Market Reports
thumbnail
Market NewsProfits: Back in the blackProfits: Back in the black
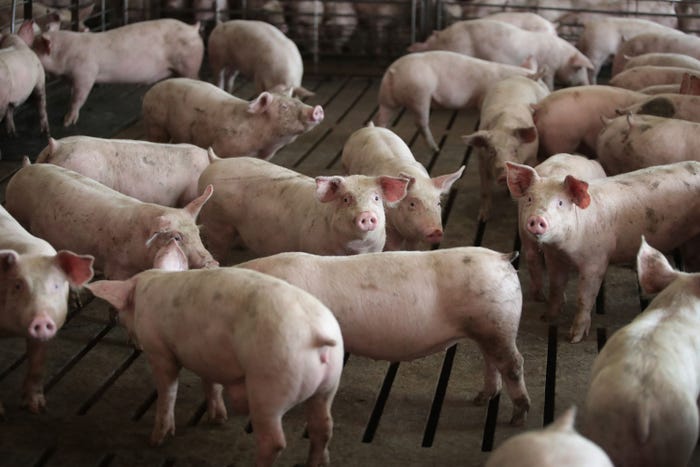
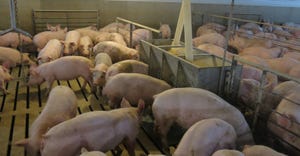
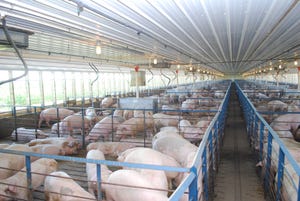
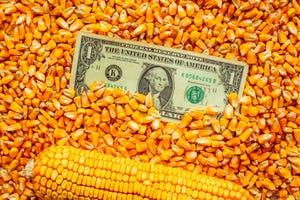
USDA is forecasting this year’s pork production will be up 2.9% and hog prices will be up 7.5% compared to 2023.


.jpg?width=300&auto=webp&quality=80&disable=upscale)

.jpg?width=300&auto=webp&quality=80&disable=upscale)


Recent Headlines


Enter a zip code to see the weather conditions for a different location.

Sep 27, 2023
Sep 27, 2023
Global Hog Industry Virtual Conference
Subscribe to Our Newsletters
National Hog Farmer is the source for hog production, management and market news