Pork demand has been good but declined in 2023
Biggest concern is younger consumers not eating as much meat in general and pork in particular.
February 12, 2024

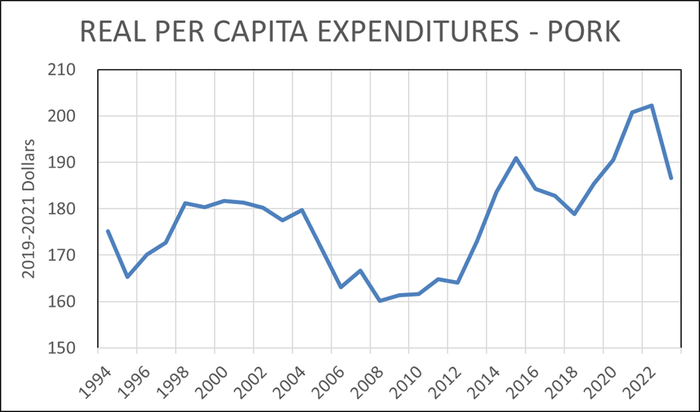
2023 will not go down as a banner year for domestic pork demand when compared to the immediate two prior years. But in a longer-term context, 2023 was still the fourth best year since 1990 according to my calculations of real per capita expenditures for pork.
Figure 1 shows annual RPCE for pork back to 1988. By this measure of demand 2021 and 2022 were the best years ever for consumer level pork demand in the U.S. Those years were, I believe, driven largely by the Covid and post-Covid stimulus payments that put trillions of dollars into consumers’ hands. Note that all RPCE measures are in constant 2019-2021 dollars.

Meyer. Figure 1.
The 2023 observation of $188.56 2019-2021 dollars was 7.7% lower than that of 2022 but was still the fifth highest on record, trailing only 2015 and 2020-2022. The end of stimulus payments definitely lowered consumers’ income levels and higher inflation rates in 2021 and 2022 further depleted consumers’ purchasing power in 2023. Higher beef prices have not been enough – yet – to push pork demand higher.
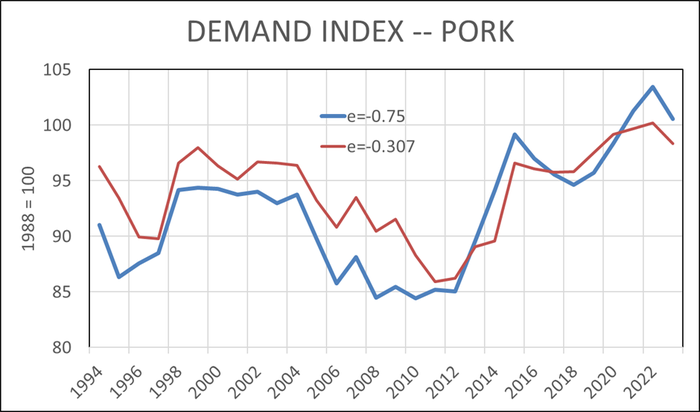
It is only fair to note that RPCE is not the only measure of pork demand. Demand indexes were, to my knowledge, first used by Professor Glenn Grimes at the University of Missouri back in the 1980s to track the level of demand for all meat species. An index states a measurement in terms of some base time period. Figure 2 shows two computations for the pork demand index since 1994. Note that the base year is 1988. The demand index calculations use exactly the same data as the RPCE calculations except for one item: An assumed elasticity of demand. Note that elasticity of demand is a measure of the sensitivity of pork purchases to pork prices. The smaller the number the less sensitive is quantity to price changes. he converse is also true: A smaller elasticity means that prices are more responsive to quantity changes.

Meyer. Figure 2.
The blue line in Figure 2 is based on an assumed elasticity of -0.75. It looks very much like the line in Figure 1 for RPCE. I also include a line in Figure 2 using and elasticity of -0.307. This is the elasticity used by economists at Kansas State University in their demand index calculations. This “less elastic” measure smooths the demand index line significantly but leave the same general patterns in place. In fact, the line with the smaller elasticity indicates that pork demand has been at its highest level in the last 30 years in 2020-2023.
No matter how you depict it, pork demand has been good but declined in 2023. And no matter how you cut it, that is not good. But staying above other years is a positive that we should not ignore.
I’m not exactly sure what to expect for pork demand in 2024. The economy remains strong – surprisingly so to most observers. Unemployment is low. Inflation is not low but is no longer out of control. In fact, inflation may be enough in control to allow the Federal Reserve to relax interest rates a bit, though I personally do not expect that to happen soon. Consumer confidence is still quite low but I have to believe that political and cultural turmoil underlies some of that concern.
Most everyone still expects the beef industry to begin building the cow herd at some point and that will remove some heifers from the slaughter mix, reduce beef supplies even further and push beef prices higher. My “economist school” training says that should be good for pork demand.
My biggest concern is that younger consumers are apparently not eating as much meat in general and pork in particular. We will not likely see that impact in 2024 but this is a big challenge for futures years. The National Pork Board was cited in a Wall Street Journal article last week as thinking that per capita consumption could fall by 2.2 pounds over the next decade due to this demographic/preference shift.
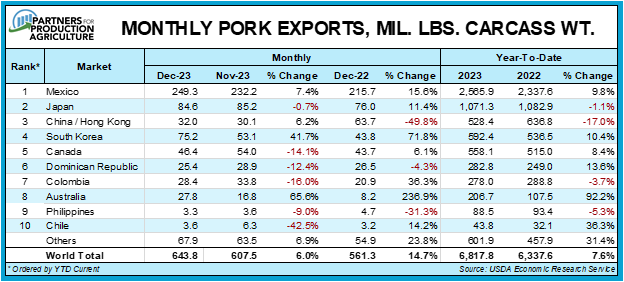
The better demand news for 2023 was exports – up 7.6% in carcass weight for the year. See Figure 3. The 6.819 billion pounds carcass weight annual total is the third largest ever – trailing only 2020 and 2021 when China was buying pork from every one that would sell it! The value of U.S. pork exports rose by 6%, year/year, in 2023.

Meyer. Figure 3.
It is clear that Mexico is the hero among our export markets. Mexico is over twice as large as second place Japan and accounts for over 37% of total U.S. exports. An important reason for this growth is the strength of the peso – a statement that I once thought I would never make. Mexico displaced China as the largest exporter to the U.S. last year. Those trade gains are in important driver of the stronger peso and are not likely to change quickly given the movement of U.S. supply industries from China in recent years.
Good growth for Korea is an indicator of the decline of EU exports that will likely continue in 2024 and beyond. In 2020, the EU exported 5.175 million metric tons of pork. They shipped just 3.1 million metric tons in 2023 and USDA’s Foreign Ag Service predicts that will not change in 2024.
FAS forecasts U.S. exports at 3.116 million metric tons this year, putting us back in the lead for the first time since 2014. Both Global Agritrends and USMEF expect U.S. exports to grow by 4.5% in 2024. FAS predicts growth of only 1.5%.
About the Author(s)
You May Also Like


