Hogs and Pigs history, implications
Two years of losses and resurgent productivity will likely force the 6 million head breeding herd lower.
December 12, 2023
USDA’s next quarterly Hogs and Pigs report will be released on Dec. 22 at 2 p.m. Central Time. While all of these reports are watched closely, this one might get some extra attention due to the losses incurred by producers over the past two years and the very real prospects of losses for most of 2024.
I have written and spoken extensively since midsummer that one or more of three things have to happen for pig producers’ economic prospects to improve. They are:
Demand must improve.
Costs must decline.
Pork supplies must decline.
The good news is that the first two are happening. But they are happening at a rate and magnitude that will not return the producer segment to profitability. And it is unlikely that the rates or magnitudes of change will get large enough to do that any time soon.
That leaves us with supplies and our read on pig numbers and pork supplies always starts with USDA’s Hogs and Pigs report. So let’s look at some long term data to see what this report and those to come in 2024 may have to say.
Breeding herd
Figure 1 shows the U.S. breeding herd back to December 1973. The consolidation of a quite extensive, land-based production system into an intensive, confinement-based system is quite clear. The reduction from 10.3 million head in 1978 to roughly 7 million head in 1987 was the first step of the move away from pasture farrowing and feeding to indoors technology.
The final consolidation began in 1998 when widespread usage of artificial insemination and new technologies like early weaning began to come to the forefront. The surge in breeding herd numbers in 1996 and 1997 marked a major consolidation of the U.S. pork industry into larger units that were, at least in part, built to beat a surge of more stringent environmental regulation of the pork industry.
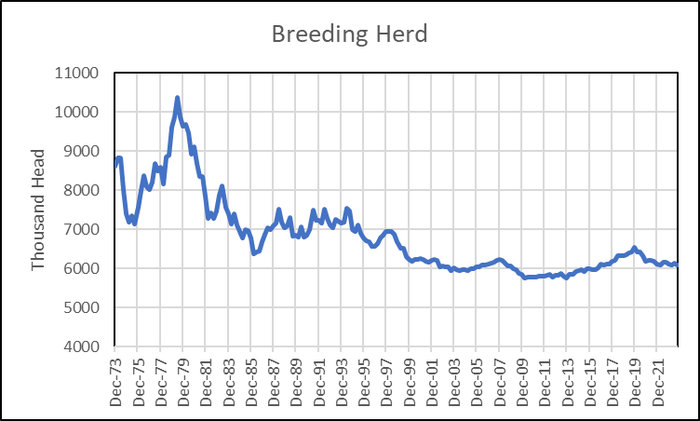
Meyer. Figure 1.
Since the liquidation driven by the price crisis of 1998, the U.S. herd had been generally stable. The two significant moves were the liquidation of 2007-2008 which was driven by the introduction of circovirus vaccines and the resulting surge in piglet survival, and the slow buildup of the herd from 2013 through 2019 that, in my opinion, was primarily driven by growing U.S. pork exports.
Farrowings and pig crop
Figure 2 shows quarterly farrowings and pig crops since 1993. The most striking feature of this chart is the huge reduction in volatility of these two series in the mid 1990s. That reduction, of course, was driven by the move from outdoor to indoor pig production and the reduction in farrowing seasonality that saw large number of litters in the March-May quarter and far fewer litters in the December-February quarter.
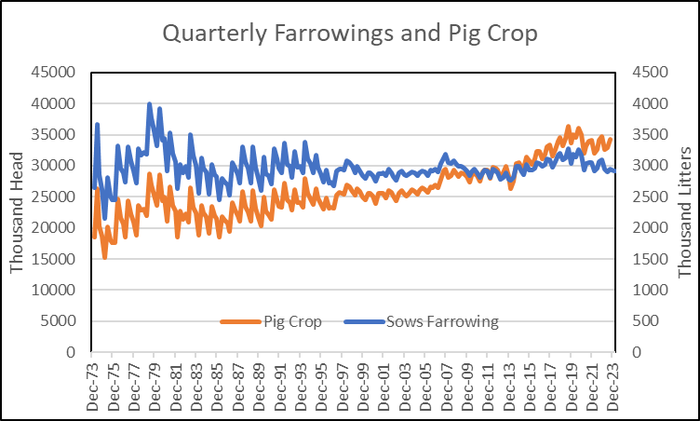
Meyer. Figure 2.
In addition to reducing pig production seasonality, this change meant that the U.S. industry needed far less packing capacity in the fourth quarter of the year. Since the packing sector maintained excess capacity to handle these seasonal surges, the sector rationalized significantly in the late 1980s and early 1990s leading to the first “capacity crunch” in 1994 and the far more serious “capacity crisis” in 1998.
Rising productivity can also be seen by the steady increase of the U.S. pig crop even as farrowing remained more-or-less steady from 1995 onward.
Farrowing rate
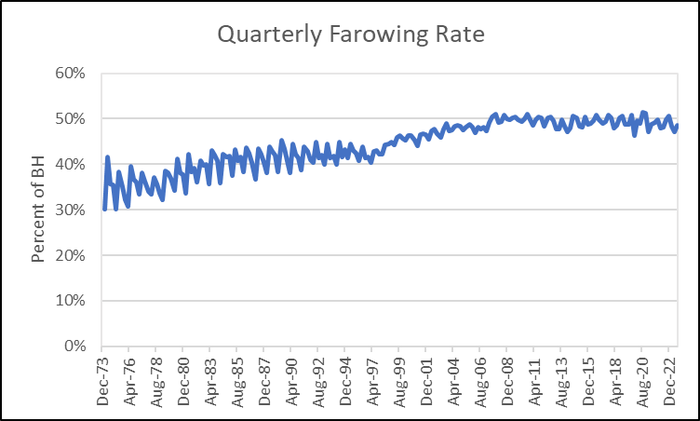
Figure 3 shows the quarterly farrowing rate implied by breeding herd and farrowings data in the Hogs and Pigs report. Here again the move from outdoor seasonal production to confinement production is quite clear. And that change also set off a rapid increase in farrowing rate as operations went away from pen mating systems to hand mating systems and artificial insemination.
Meyer. Figure 3.
But it is clear that there is a limit to what can be accomplished on this measure. Biology dictates that a sow can farrow no more than about 2.57 litters per year assuming 114 days for gestations, 21 days for lactation and 7 days for wean-breed interval. About the only wiggle room there is lactation length and efforts to shorten lactations in the 2000s proved of limited value due to piglet performance and re-breeding challenges.
The max of 2.57 litters per year would translate into 0.64 litters per quarter and the industry as a whole has been able to, in practical conditions, reach only 0.515 litters per quarter. Part of that is due to the inclusion of replacement gilts and boars in the breeding herd but it also shows that a lot can and does go wrong in the breeding barn.
Pigs saved per litter
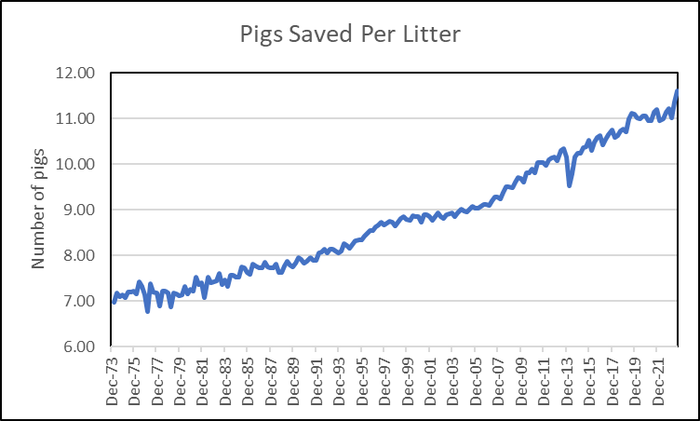
The final key variable is shown in Figure 4 and this has been an impressive success story. Litter sizes were growing even in the days of seasonal farrowing. But the rate of improvement in rotational or even roto-terminal systems was limited and things started to really change when confinement systems began to use females bred only to be sows and terminal boars as sires.
Meyer. Figure 4.
From September 2007 through September 2023, average litter size grew from 9.29 to 11.61 pigs. That is an annual growth rate of 1.55%.
What does this all mean for today?
First, we have to plan on higher productivity. The surge of the past two quarters overcomes the disease and labor challenges of 2021 and 2022 and puts producers right back on their long-term growth trend for litter size. That 1.55% matches almost perfectly with the rate of improvement in nucleus herds reported by genetic companies. And there is no reason it will change. EU producers are still ahead of us so we know that yet larger litters are possible. Producers are individually better off with larger litters – so they will happen!
Second, the breeding herd seems to have a long-term comfort point at about 6 million head. Two years of losses and resurgent productivity will likely force it lower but it appears to me that breaking that level will be painful. Just as a futures chart bounces off a support level, the 6 million level represents an established number of firms of a particular size. The increase in costs that, at least to a significant degree, appears to me to be permanent likely tells this market that that number of breeding animals is not sustainable. I do not look for a sub-6 million herd in this report but I believe it is coming in 2024.
About the Author(s)
You May Also Like


