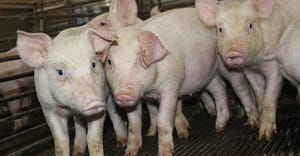
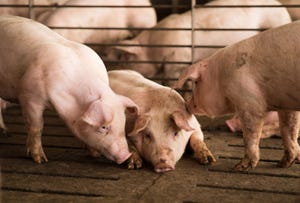
Hog Reproduction
thumbnail
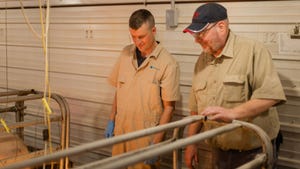
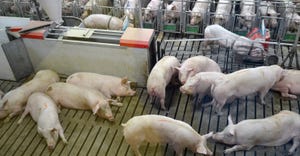
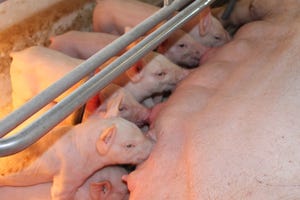
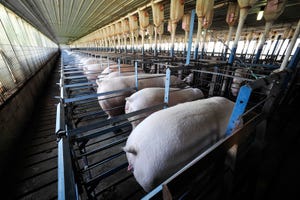
Livestock ManagementGetting the best out of a breeding operationGetting the best out of a breeding operation
What does it take to get the best out of a breeding operation? John Quackenbush of Minitube joins us with some tips.


.jpg?width=300&auto=webp&quality=80&disable=upscale)
Recent Headlines


Enter a zip code to see the weather conditions for a different location.

Sep 27, 2023
Sep 27, 2023
Global Hog Industry Virtual Conference
Subscribe to Our Newsletters
National Hog Farmer is the source for hog production, management and market news