U.S. sow mortality trends continue to climb
Three key reasons for removal are prolapses, body condition and general health.
December 13, 2023
By Bradley Eckberg, MetaFarms
Here we go again. I never want to sound like a broken record but stop me if you have heard this before, “Sow death loss continues to increase.” Within this article it shows that 2023 sow death loss has increased again—in fact, to a record high level. Along with that, we will dive deeper into areas of when and why these deaths are occurring with a goal of reinvigorating this very important topic to the U.S. pork industry.
Sow farm analysis was performed utilizing the MetaFarms Ag Platform with specific focus on the U.S. customers only. In the calendar year 2023, the average number of sow U.S. sow farms was 300, with an average female inventory of 800,000. The average sow farm size was 2,666, with the smallest farm size of 500 females and the largest at 11,000 females. A sow death loss includes either a gilt or sow that has been recorded as a removal from the sow unit by a removal type of death or euthanized. Other removal types, such as cull and transfer, have been excluded from this data.
2023 data consists of performance between Jan. 1 to Nov. 30.
Sow mortality trends
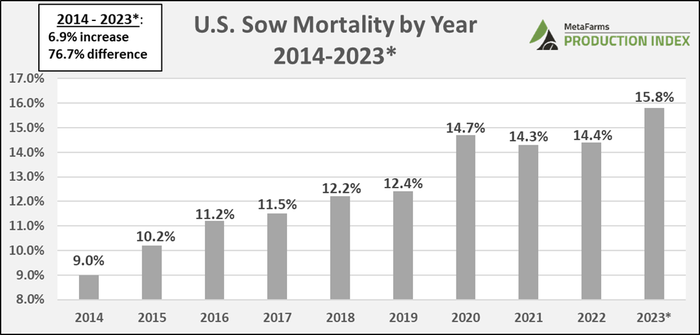
Below is a 10-year chart for average U.S. sow death loss from 2014 thru November 2023. This graph should be quite alarming to see the 6.9% (76.7% change) increase from not only 2014 to current, but also the 1.5% increase from just last year. To put the 15.9% average for 2023 into perspective, 318 females would have died in total for the year, six per week, or 0.87 every day. In 2014, 9% average death loss for a 2,000 head sow unit would have accounted for 180 deaths, 3.5 deaths per week, or 138 less total deaths than in 2023.
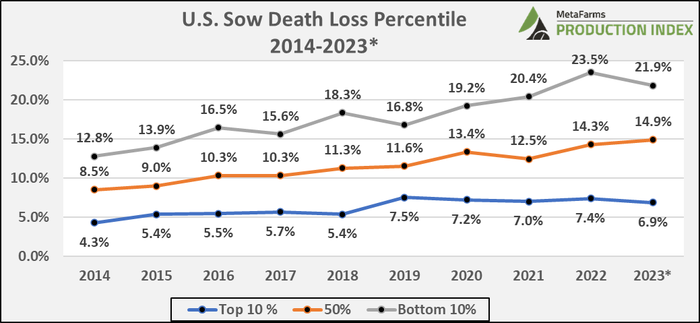
The next chart shows the same 10-year U.S. sow death loss trends however, this time the information is broken down by three different percentiles. Top 10% would represent approximately the lowest 30 sow farm’s average death loss. The top 10% high/low difference across these 10 years was 3.2% (7.5% vs 4.3%) whereas the bottom 10% high/low difference was a staggering 10.7% (23.5% vs 12.8%). The 50th percentile high/low difference was 6.4% (14.9% vs 8.5%).
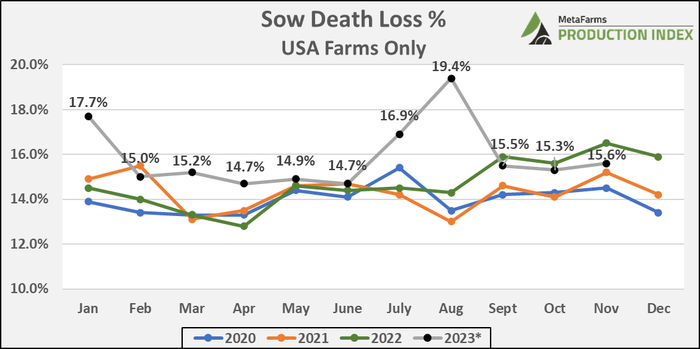
The next chart shows the last four years of monthly death loss with the grey line with black circles representing 2023 which, unfortunately, only four of the eleven months are below any of the previous three year’s monthly averages. August 2023 (19.4%) has been the highest monthly average over the last 10 years.
Seasonally, new porcine reproductive and respiratory syndrome incidents begin to occur in the months of October and November. As depicted in the next graph, sow death loss begins to rise during these months and continues until February of the next year. Spring months rates usually level off until the hot summer months where losses begin to increase.
2023 Sow death loss reason analysis
Now that the historical trends have been established, we will now look into the “why” sows are dying. There are many different avenues to go down when analyzing these losses from: genetics, nutrition, health, animal husbandry, seasonality, sow farm size, pens versus crates, and many more. For this analysis, there will be a focus on removal reasons and then a deeper dive into prolapse losses.
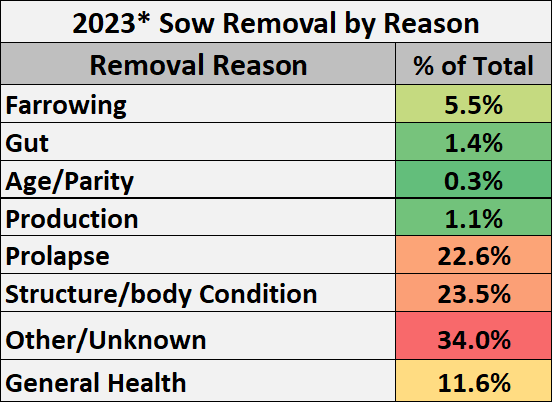
Within the MetaFarms database for 2023, there were over 500 different sow removal reasons. To help with analyzing these reasons, this long list of reasons was grouped into eight different rollup reasons. Below is a general breakdown of each rollup removal reason with sub-reasons to help you better understand what reason falls into which rollup reason.

Next is a summary of rollup sow removal reasons for 2023. Other/unknown once again makes up the largest reason. Often, necropsies of dead females do not occur as often in sow farms than within a grow finish site, so it is up to the caretakers to use their best judgements if there are no obvious visual signs.
MetaFarms
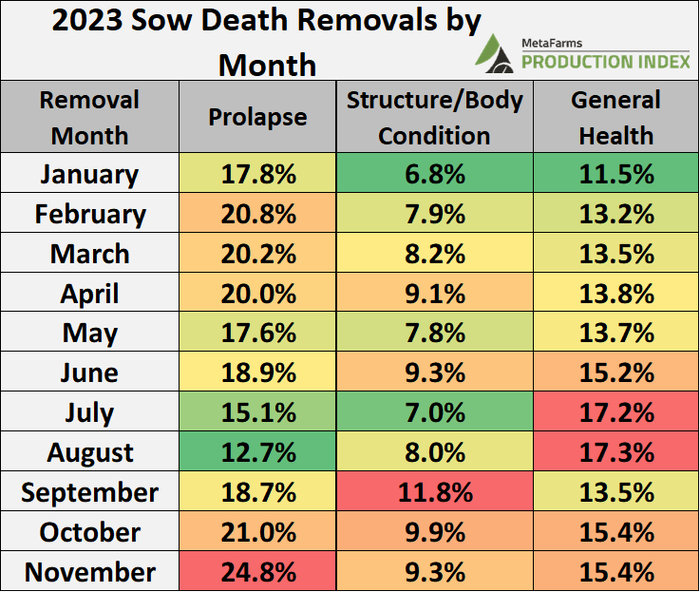
Setting aside the removals found within the other/unknown reason, the next graph looks at the next three largest percentage of removals reasons for 2023 broken down by removal month. Below are key observations of this data:
Prolapse: Higher rates in the colder months, lower in the hottest months
Structure/Body Condition: Increased rates in the latter parts of the calendar year
General Health: Highest rates in the hottest months of the year
Prolapse analysis
For years now, when talking about sow death loss, a focal death reason of prolapse has been a hot topic. Uterine, rectal and both prolapse reasons have been combined for this analysis. As noted previously, 22.6% of all 2023 sow deaths losses occurred by way of prolapses.
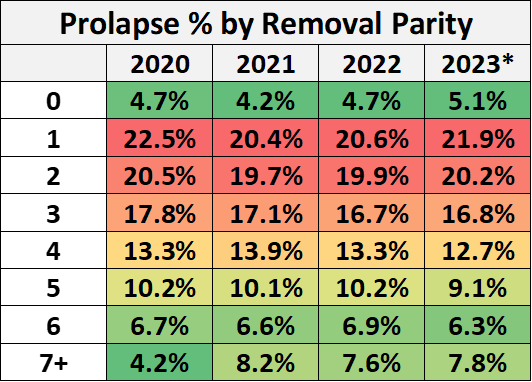
The next chart shows the last four years of prolapse removal percentage by parity. Normally, one would assume that those higher parity (5 or greater) would be more vulnerable to prolapsing however, just the opposite is true. In 2023, 23.3% of prolapse deaths were parity 5 or greater whereas, 47.2% of prolapses occurred between parity zero to two. Breakeven price for a gilt is parity 3 so the financial hit to a producer due to prolapses was very high in a poor fiscal year that was 2023.
MetaFarms
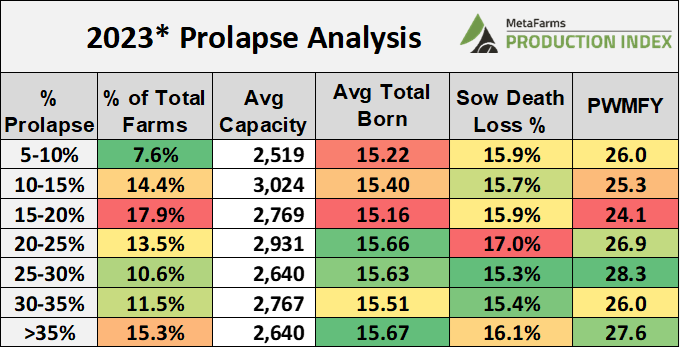
The next chart is a 2023 analysis of all U.S. sow farms by the overall percentage of total prolapses against other death removal reasons, along with average farm capacity and a few key performance indicators. Data shows that 17.9% of all MetaFarms U.S. sow farms had between 15-20% of all deaths due to prolapses. Those farms had an average capacity of 2,769 females, 15.16 average total born, 15.9% sow death loss, and 24.1 pigs weaned per mated female per year.
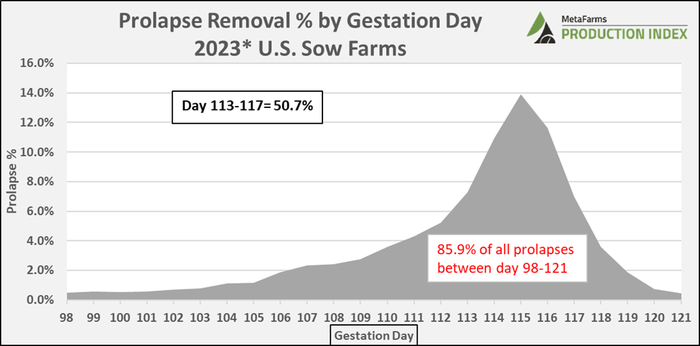
Below is a chart that depicts 2023 U.S. sow farm deaths, for prolapses only, by gestation day. The first mating for a service would be considered day 1. In 2023, 85.9% of all 2023 prolapse deaths occurred between days 98 to 121, with 50.7% of those occurring between 113 to 117, or right amid the farrowing event.
As a small child, I grew up in Minnesota’s heaviest pig populated county, Martin County. I remember one day standing outside of a finishing barn and counting nine other pig barns in the surrounding area. A combination of both sow farms and grow finish facilities that can easily spread disease by air, foot or equipment. As a token of positivity or a beacon of hope, let me share a conversation I recently had with a producer with 2 sow farms located in Martin County. This producer has a sow mortality rate of 5.8% for 2023 which is up from his 2022 average of 3.1%.
When asked how his farms were able to keep such low death losses, his comments back were these:
Numerous employee training courses on animal husbandry. Seeing every pig, every day!
Proper gilt developer management from feed, vaccinations and selections
Good swine genetic lines for the female.
Teamwork between management, nutrition and the veterinarian.
Health: His farms have been able to keep all major diseases (PRRS, porcine epidemic diarrhea, Mycoplasma) out of the farm.
Data: Weekly and sometimes daily analysis of why animals are dying along with trends to capture outliers.
We must be focused and diligent every day because if we lose focus and get lackadaisical, then we are bound to continue to see more sow deaths which directly impact the bottom line for producers where most U.S. pork producers are struggling financially. See every pig, every day!
MetaFarms Analytic Insights were used to provide the context and trends for this article. If you would like to talk or see an analysis of sow death loss trends for your farm, or if you have suggestions on production areas to write articles about, please e-mail or call us. We enjoy being a part of the National Hog Farmer Weekly Preview team. Previous Production Preview columns can be found on the National Hog Farmer website.
If you have questions or comments about these columns, or if you have a specific performance measurement that you would like us to write about, please contact Eckberg via email.
You May Also Like


