Subscribe to Our Newsletters
National Hog Farmer is the source for hog production, management and market news
Part 2 in the series “What have we learned about feeding DDGS to pigs over the past 20 years?”
November 1, 2018

By Jerry Shurson, University of Minnesota Department of Animal Science
Accurate estimates of energy and digestible amino acid and phosphorus content of feed ingredients is one of the most important factors for achieving precision swine nutrition when formulating diets. Using accurate nutritional composition values minimizes the risk of over-feeding or under-feeding energy and nutrients relative to the pig’s requirements. They are also important for capturing the greatest economic value of feed ingredients by minimizing “safety margins,” which are frequently used to manage uncertainty of nutritional composition of feed ingredients formulating swine diets.
Furthermore, if nutritionists have confidence in the energy and digestible amino acid values of the sources of feed ingredients they are using, they are more likely to increase diet inclusion rates if they are competitively priced to obtain greater diet cost savings.
Related: 20 years of DDGS lessons in pig diets
Nutrient content varies in all feed ingredients, but some animal nutritionists often complain that the nutrient content among distiller’s dried grains with solubles sources is too variable for them to use it compared with other common feed ingredients. While it is well documented that the energy, nutrient content and digestibility is variable among DDGS sources, it is no more variable than the nutrient content of other common feed ingredients.
Related: 20 years of DDGS lessons in pig diets
Installments in the DDGS series
Part 1: 20 years of DDGS lessons in pig diets
Part 2: Varied energy and digestible amino acids levels in DDGS manageable
Part 3: Work continues to evaluate performance responses from feeding DDGS
Part 4: Managing carcass yield, pork fat quality when feeding corn DDGS
Part 5: Reaching an understanding of fiber characteristics of corn DDGS
Part 6: Enzymes, pre-treatment improve fiber and nutrient digestibility
Part 7: DDGS show greater antioxidant capacity than in corn grain
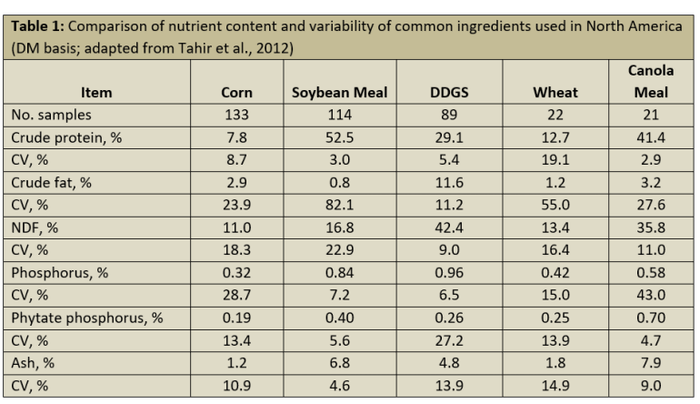
In fact, Tahir et al. (2012) conducted a feed ingredient analysis survey of common feed ingredients used in North America, and calculated the coefficient of variation for several chemical components. Their results showed that the CV of crude protein was less among samples of DDGS (5.4%) than among samples of corn (8.7%) and wheat (19.1%; Table 1). Furthermore, DDGS has the least variability in NDF and phosphorus content compared with corn, soybean meal, wheat and canola meal.
However, as expected, the variability in crude fat content among DDGS sources was the greatest among these feed ingredients due to the fact that the majority of U.S. ethanol plants are partially extracting variable amounts of corn oil prior to manufacturing DDGS. However, the high CV in crude fat content is partially attributed to the greater average crude fat content of DDGS (11.6%) compared with the crude fat content of the other ingredients (0.8 to 3.2%) used in this comparison.
Risks of using ‘static’ published databases
Nutrient composition of feed ingredients changes over time. Therefore, relying on “static” published book values from old published databases can lead to significant over- or underestimation of actual energy and nutrient content of commonly used feed ingredients. This is even more critical for DDGS because the nutrient composition continues to change as ethanol plants adopt new processes to improve ethanol yield, extract more corn oil, and enhance protein and amino acid content. Therefore, when determining appropriate and accurate nutritional values for DDGS, it is important to consider the dates of publications used to compile these databases because the nutrient composition began changing when the U.S. ethanol industry began partially extracting corn oil in 2005.
Today, the majority (> 95%) of U.S. ethanol plants are partially extracting corn oil, resulting in a high proportion of DDGS sources containing between 5% to 9% crude fat compared with conventional sources containing 10% to 13% crude fat. This reduction in oil content not only increases the variability in crude fat content among DDGS sources, but it also changed the profile of other nutrients. However, although many nutritionists often assume that crude protein and amino acid content increases as crude fat content decreases in DDGS, this is not always the case. There is often a disproportionate increase in all other chemical components of DDGS as the crude fat content is reduced.
Approaches to manage energy variability among DDGS sources
Prior to conducting research to determine the impact of reductions in crude fat content on the ME and NE content of reduced-oil DDGS, the Swine NRC Committee (2012) reasonably assumed that the reductions in crude fat content in DDGS would result in a reduction in DE, ME, and NE content for swine. As a result, National Research Council (2012) provided estimates of energy and nutrient profiles of DDGS categorized based on crude fat content. Unfortunately, there were limited data on the ME content and nutrient profiles for medium-oil (n < 13 for 6% to 9% crude fat DDGS) and low-oil (n < 2 for < 4% crude fat DDGS) sources at the time of publication.
Therefore, these published values do not accurately reflect the variation in nutrient content of the majority of reduced-oil (5% to 9% crude fat) DDGS sources currently available from U.S. ethanol plants.
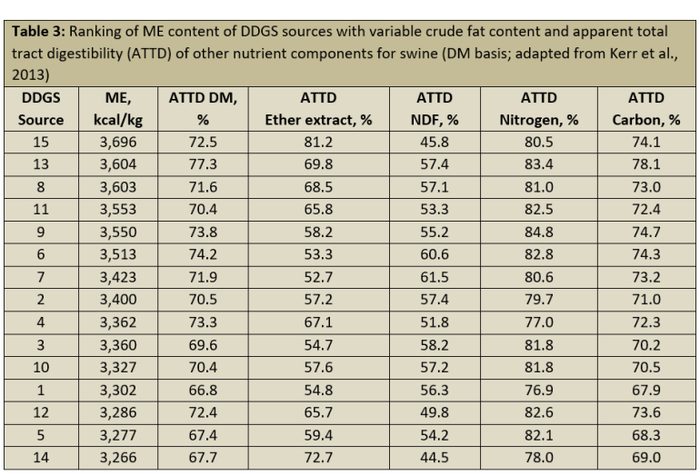
Subsequent research studies have clearly shown that crude fat content is a poor single predictor of DE, ME and NE content for swine (Table 2; Kerr et al., 2013, 2015). It appears that this poor relationship between crude fat content and energy value in DDGS is due to the relatively high variability in ether extract (crude fat) digestibility (52.7% to 81.2%) and NDF digestibility (44.5% to 61.5%) among sources (Table 3).

To manage the inherent variation in chemical composition among DDGS sources, some commercial feed manufacturers identify specific sources that meet their nutritional specifications and quality standards, and work directly with DDGS marketers that have the capability of providing identity preservation of DDGS sources. These commercial feed companies develop preferred supplier lists to minimize variation in DDGS purchases through third party marketers. Although these approaches are somewhat useful, perhaps the best approach is to use the recently developed and validated ME and digestible amino acid prediction equations, based on chemical composition of DDGS sources, to accurately and “dynamically” estimate the actual nutritional value of the source(s) being used.
Several studies have been conducted to develop DE and ME prediction equations based on physical and chemical composition of corn DDGS sources for swine (Stein et al., 2006; Pedersen et al., 2007; Stein et al., 2009; Anderson et al., 2012; Kerr et al., 2013), and to manage variability in ME content among sources. These equations have been cross-validated (Urriola et al., 2014) and further validated with a growth performance trial (Wu et al., 2016a).
However, it is important to note that energy prediction equations from NRC (2012) should not be used for estimating the energy content of DDGS because they underestimate the actual ME content of reduced-oil DDGS sources (Urriola et al., 2014). Therefore, the most precise (prediction error = 144 kcal/kg) and accurate (bias = 19 kcal/kg) DE equation was:
DE = -2,161 + (1.39 × gross energy) – (20.7 × NDF) – (49.3 × ether extract)
The most precise (prediction error = 149 kcal/kg) and accurate (bias = -82 kcal/kg) ME equation uses the DE value obtained from the previous equation as follows:
ME = -261 + (1.05 × DE) – (7.89 × crude protein) + (2.47 × NDF) – (4.99 × ether extract)
Most recently, Wu et al. (2016b) fed four DDGS sources with variable crude fat and estimated NE content to growing-finishing pigs, and used growth performance responses along with the NRC (2012) requirement model to estimate actual NE content of these sources. The NE estimates ranged from 2,182 to 2,915 kcal/kg DM, with an average of 2,660 kcal/kg DM. These estimates are substantially greater than those published in NRC (2012), but similar to those reported by Graham et al. (2014). Wu et al. (2016b) used the results from Kerr et al. (2015) and Wu et al. (2016b) to develop a NE prediction equation for DDGS with oil content ranging between 5.8% to 12.2 % ether extract:
NE (kcal/kg DM) = -1130.5 + (0.727 × gross energy) + (23.86 × ether extract) – (10.83 × NDF)
(R2 = 0.99; P < 0.01).
However, the accuracy of the predicted NE values for reduced-oil DDGS using this equation has not been validated in feeding trials with growing-finishing pigs. Summarizing all of the available published results, the most conservative estimate of NE content in reduced-oil DDGS is 2,012 kcal/kg, but using an average NE value of 2,374 kcal/kg DM may be appropriate for most DDGS sources.
Approaches to manage digestible amino acid variability among DDGS sources
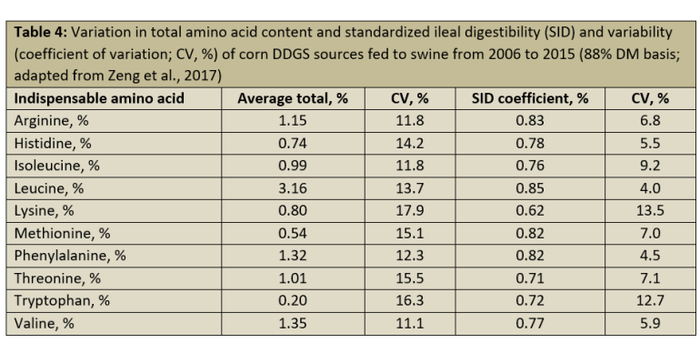
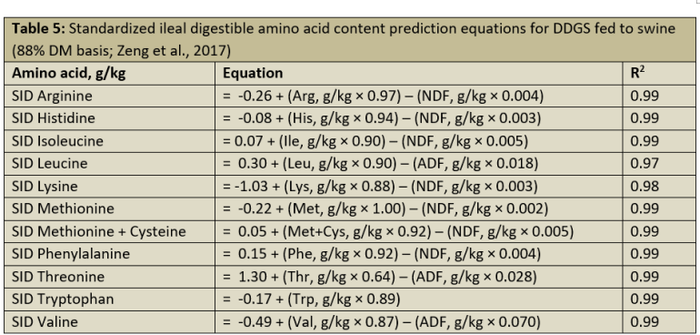
Recently, Zeng et al. (2017) summarized digestible amino acid data sets from 22 peer-reviewed publications and one M.S. thesis published between 2006 and 2015 (Table 4), and conducted a meta-analysis to develop standardized ileal digestible amino acid prediction equations for reduced-oil DDGS for swine (Table 5). These data are more reflective of the actual chemical composition and variability among corn reduced-oil DDGS sources than those reported by NRC (2012) because they are based on 90 observations. Their results showed that the amino acid and NDF or ADF content of DDGS are good predictors of SID amino acid content of DDGS for growing pigs, and the accuracy and precision of these prediction equations are much improved compared to those from previously published studies. As a result, these equations can be used to accurately estimate the SID amino acid content of a wide range of reduced-oil DDGS sources for swine.
References
You May Also Like
Enter a zip code to see the weather conditions for a different location.


