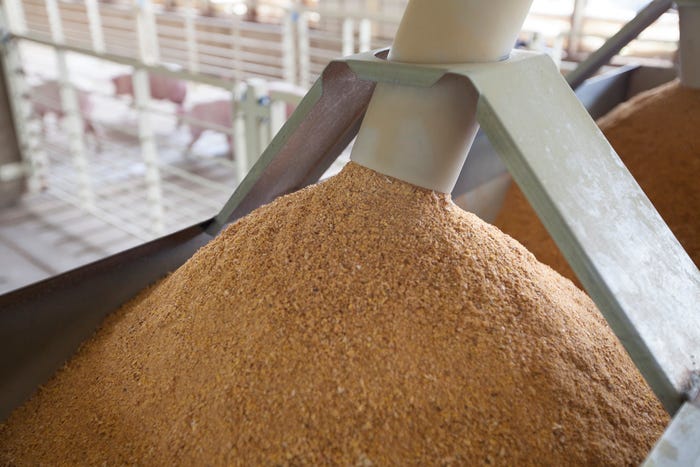
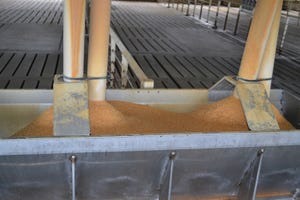
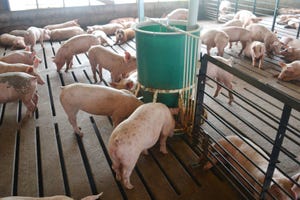
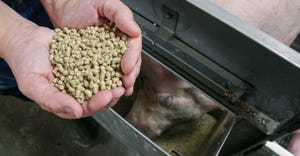
Hog Nutrition
thumbnail
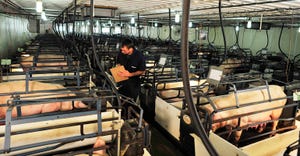
Livestock ManagementTechMix hires Chris Allen as Swine Territory Sales RepresentativeTechMix hires Chris Allen as Swine Territory Sales Representative
Allen joins firm with the last 18 years of his career focused in the swine industry.


Recent Headlines


Enter a zip code to see the weather conditions for a different location.

Sep 27, 2023
Sep 27, 2023
Global Hog Industry Virtual Conference
Subscribe to Our Newsletters
National Hog Farmer is the source for hog production, management and market news