Market Responds to Bullish Hogs and Pigs Report
The United States Department of Agriculture’s June Hogs and Pigs report was bullish, and that bullishness was clearly reflected in the futures trade.
June 30, 2014

The United States Department of Agriculture’s June Hogs and Pigs report was bullish, and that bullishness was clearly reflected in Monday's futures market with Lean Hogs contracts from August through May 2015 up the daily limit and June through August 2015 contracts up $2.80 or more.
USDA’s numbers were almost all lower than analysts expected in pre-report surveys and I still fear that some of the market inventory numbers may not be low enough. Figure 1 shows the June 1 data for this year, last year and the actual and expected year-on-year changes.
Of particular note are the figures that are bolded in Figure 1. All of them have some significant connotations.
FIGURE 1
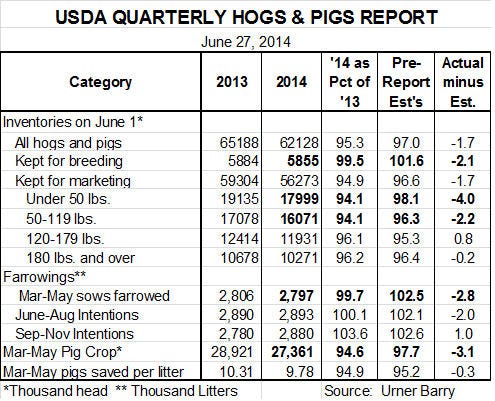
The June 1 breeding herd was estimated to be 5.855 million head, 0.5% lower than one year ago. Analysts had expected, on average, a healthy increase of 1.6% in the herd relative to last year based, I presume, on the fact that profit margins have been superb and hog producers have never been able to suffer such good times for long. Computations such as my margin estimates based on Iowa State University’s production parameters and futures prices say those margins have indeed been huge.
The trouble is that a lot of hogs were hedged at much lower — but still quite profitable — prices this summer, leaving things not quite as rosy as many believe. Those short hedges have tied up a lot of capital, at least for the short run. Add in that it’s probably hard to think of expansion when pigs are dying by the truckload and one can see why I expected much more modest expansion and am really not surprised much by the slight reduction. Regardless of your pre-report expectation, though, this number and no surefire solution to porcine epidemic diarrhea virus (PEDV) suggest that production will not grow much, if any, by mid-2015. That conclusion might very easily be true for all of 2015.
Under-50 and 50-119 lb. inventories were found to be nearly 6% lower than last year. First I note that the -5.9% figure for the under-50 category fits well with the -5.4% for the March-to-May pig crop. One “smell check” passed. Those pigs weighing less than 120 pounds were born from mid-February through May. PEDV case accessions peaked in mid-February and declined through that time period but were still at monthly peaks in February and March. My computations showed double-digit year-on-year reductions for February and March and nearly 8% reductions for April. Allowing for lower porcine reproductive and respiratory syndrome virus losses and some double counting, the USDA’s numbers may be close but I still think slaughter will be hard-pressed to match those 5.9% year-on-year declines in August and September for sure – and perhaps October.
March-to-May farrowings of 99.7% agree closely with the breeding herd on June 1 and on March 1 so another internal consistency check gets a passing grade. Ditto for June-to-August intentions at 100.1. Close enough. But September-to-November at 103.6% of 2013 appears to be a stretch. A third of those sows were already bred by June 1 and how can there be enough sows in a “down 0.5%” breeding herd to gain that much in farrowings?
Even the March-to-May farrowings’ number is curious since those 2.797 million litters would constitute the largest December-to-February to March-to-May reduction since 1974. Did we really reduce sow numbers and farrowings that much? I think it is possible simply because of the disruptions that PEDV has wrought on so many farms. Anecdotal evidence says upward of 2 million sows did not nurse a litter of pigs since May of last year, meaning their reproductive tracts had probably not recovered completely from carrying that previous litter. Some sows did not recover from PEDV itself very well. Historical comparisons are not likely to be as dependable or useful in light of the major changes driven by PEDV.
The number of pigs saved per litter increased a bit from December-to-February but is still 5% below one year ago. This was as expected, however. The shock came from the farrowings’ number that will put fourth quarter hog supplies somewhat lower than last year.
So where will supplies go from here? I still believe that the large number of PEDV cases among suckling pigs this past spring resulted in higher death losses than the USDA has been able to find in its survey. It appears that the USDA is picking up more of that impact but the question for the rest of 2014 and into 2015 is “What will the year-on-year change in litter size look like?”
I’m assuming that the decline will get smaller but still be about 3% for the rest of this year. Recall that the USDA picked up virtually no impact in the June-to-August 2014 quarter and only a small impact in last year’s September-to-November quarter. Once we get to the coming December-to-February quarter, we should see litter size make only small negative impacts on year-to-year hog number comparisons.
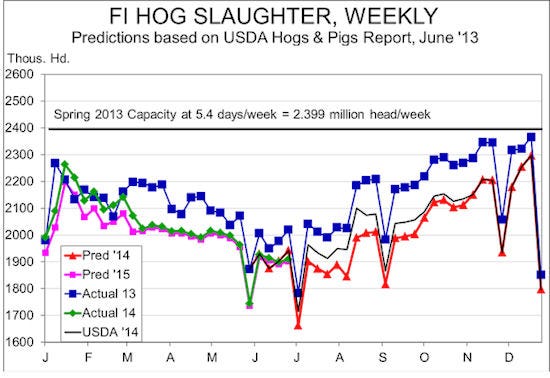
My weekly slaughter forecasts appear in Figure 2 along with those based strictly on the USDA report data. The biggest differences between the two are in the third quarter. Those get smaller in the fourth quarter. My fourth quarter and first quarter 2015 forecasts assume that litter sizes remain 3% below year ago. My second quarter 2015 forecast differs from the USDA only because I think it is unlikely that the fourth quarter 2014 farrowings can grow by 3.6%.
FIGURE 2
It appears that my second quarter price forecasts from the March report are going to be about $6 lower than the actual price for this quarter. I will increase all of my forecasts for the remainder of this year by about that amount, putting third quarter national net negotiated prices in the $124-$130 range and fourth quarter at $100-$106.
With projected first quarter 2015 slaughter only 3% lower than this year and second quarter slaughter very close to this year’s levels, I expect prices in those quarters to be lower than in 2014 due to higher carcass weights. The second quarter prices will also be compared to the unusually high prices of March and April this year.
My quarterly compilation of analysts’ forecasts will appear in next week’s Preview.
About the Author(s)
You May Also Like


