Bright future for animal ag if data play out
Values have moved up seasonally as they generally do this time of year, but is the inflection happening a bit earlier than normal and at a faster clip?
December 11, 2017
Bullish summer hogs?
In our role as risk managers, we are not in the business of picking market tops before initiating action. Generally, prudence and an appreciation for volatility will necessitate some sort of coverage well before the market peaks. We are in the business of making sound financial decisions, not guessing. It is against this backdrop that I share some observations of current market happenings and how a producer could possibly be led to believe that there may be higher summer prices on the horizon.
If you take the September Hogs and Pigs report at face value, we should be harvesting roughly 2% more in October and November relative to last year. We have been short of those numbers in aggregate. I am told by my favorite Esteemed Economist, Steve Meyer, that the discrepancy is not outside of statistical norms, but the numeric shortfall has caught the attention of several in the trade. Are the pigs still “out there” and just have yet to come to market? There is some evidence that that theory could hold water with the increasing slaughter weights. The same Esteemed Economist referenced previously shares that that the seasonal increase in weight is not outside the normal distribution either seasonally or in year-over-year comparisons. Thus, the jury is still out on the curious case of the missing pigs.
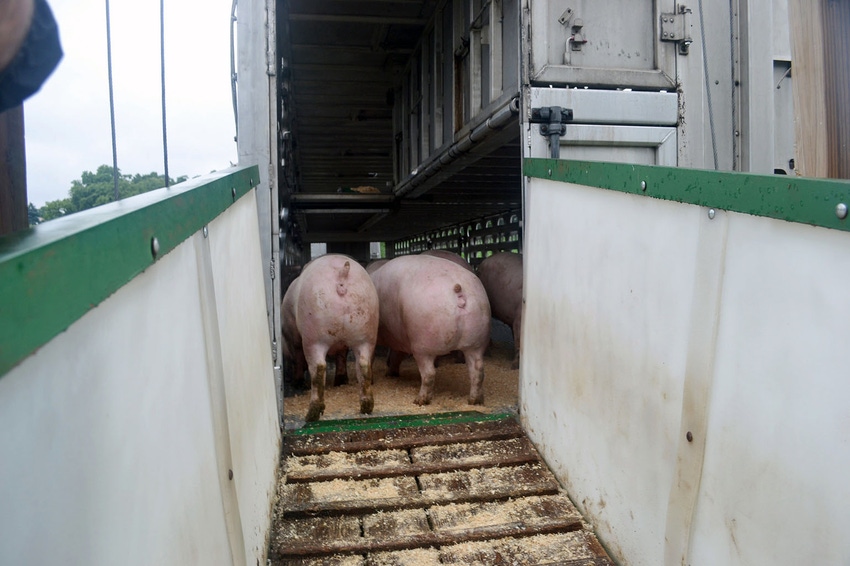
But wait! If the pigs are “out there” and not coming to market then it logically follows that we have the barn space to hold them a bit longer than initially thought. This means we have either 1) built finishing barns faster than the increase in pig flow or 2) we are not weaning the expected animals right now to shove the heavier ones out of the barn. It is the latter posit that I want to wrestle with in order to see if we have any further incidences that may merit consideration.
Let’s take a look at data that we can sink our teeth into and then look at the ancillary items that may support the hypothesis of potentially firmer markets for summer hogs.
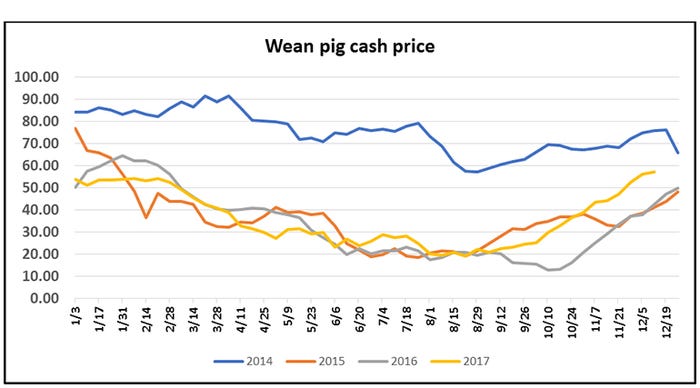
First, take a peek at the chart of wean pig prices. Values have moved up seasonally as they generally do this time of year, but is the inflection happening a bit earlier than normal and at a faster clip? Our contacts on the sales side of wean pigs as well as those trying to purchase pigs would both indicate that the supply of wean pigs relative to demand is skinny, at best. Seems that the prospect of enough empty barns and relatively low-cost corn creates a compelling story for bidding up for a shrinking supply of animals. Imports of Canadian pigs show we are running at a normal, robust pace so it does not seem to be a shortage north of the border. I suspect this is more of a domestic problem wherein we have compromised farrowings relative to expectations and the need to fill in that gap is evidenced in higher wean pig prices.
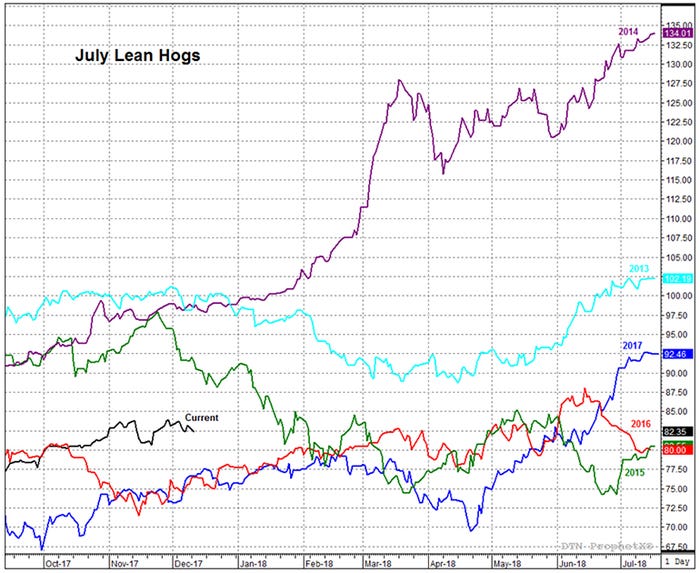
In recent history, it is common to encroach on the $90 mark in the summer. Below are the graphs of the last five years of trade for the July contract as well as this year so far. Last year was the only year that did not reach $90; it topped out just shy of $89 for its high. The porcine epidemic diarrhea year of 2014, is the obvious outlier as the pork market set all-time highs in the summer of 2014. Four out of the last five years saw hog prices exceed $90 sometime in their trading life and the other was within sniffing distance. Should we expect less this year? One of my favorite Smart People — you know who you are — has been touting $90 hogs for the summer of 2018 at the time we were trading futures below $80. Recent history would indicate that it is certainly possible, and perhaps even probable, to reach loftier levels than where we are currently trading. Combine this with the tightness in the wean pig market and we seem to be writing a compelling story.
On the product front, bacon was the darling of the complex last year and its ascent to all-time highs propelled the summer month hogs on their flight higher. Belly prices have certainly been supportive through the fourth quarter of 2017 and one would think that those putting them in the freezer at the $1.40 price range are quietly hoping for a replay of last year. Bacon shortages are not just for the summer. Now look at the link where McDonald’s recently ran out of bacon in the United Kingdom. That is probably not the type of thing that leads to job security if you are the McDonald’s buyer responsible for the gaffe.
Demand in general has remained robust across the whole protein complex. We count the supply, we feel the demand. It is only when we relate price to quantity that we can discover implied demand. Remember, demand is disappearance at a price. It is that last component that is often overlooked. We can always move more product by discounting price and sliding down the demand curve. What I am referencing is an outright shift in the demand curve that allows product to move at higher values relative to previous supply/price considerations. This is a good thing. The cutout has maintained some impressive resiliency. Note that it has a tough time breaking below $70. But the more pressing question for pork producers is how to participate more fully in the value of the product. I think — think — we may have some good news on the horizon from that aspect, too. Packers managed to suppress Saturday kills in November and thus maintain margin. There is nothing nefarious about that, it just may not fit our bias. When we get to the first quarter and the pig supply seasonally declines, they would have to ostensibly eliminate a Friday kill, for instance, to achieve the same impact. How willing will they be to do that? If you have a fixed cost of labor with a union contract, backing off a weekday may be a bit tough to justify. Seems to me that the spread between the western Corn Belt value, for instance, and the cutout will have to narrow a bit as we turn the calendar.
The United States just posted October export numbers which were impressive in their sheer volume as well as their comparison to year-ago levels. It will probably be tough to maintain this year-over-year pace for November and December given the robust numbers from 2016, but I am told by exporters that ham demand in Mexico remains strong.
This leads us to the potential fly in the ointment of my thoughts that lead to $90 summer hogs — North American Free Trade Agreement. More specifically, the lack of NAFTA. I was recently at a meeting with someone well-versed in the Washington, D.C., political community who was offering (who really knows on these things?) that the odds of the United States pulling the proverbial pin on NAFTA currently stands at a 50:50 proposition. Wow. If you reference the work of Dermot Hayes — with his apocalyptic analysis of pork prices in the absence of Mexican trade — and then look at option prices associated with forward hog futures, you can surmise that the trade is currently pricing a roughly 1% chance of NAFTA going away and, with it, the prospects of favorable prices for the pork producer. A Washington, D.C., veteran thinks there is a 50% chance; the market says a 1% chance? Something is clearly out of line with this equation. I am respectful of this scenario and am not an advocate of elimination of summer protection; the option market makes sense to me as a viable vehicle for coverage.
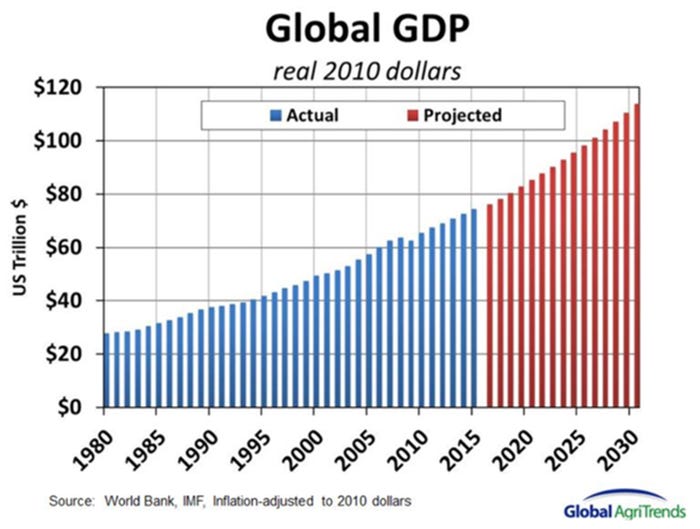
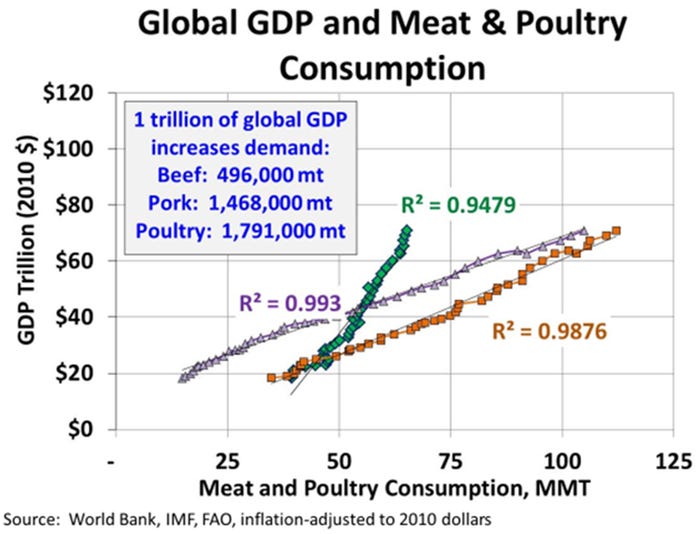
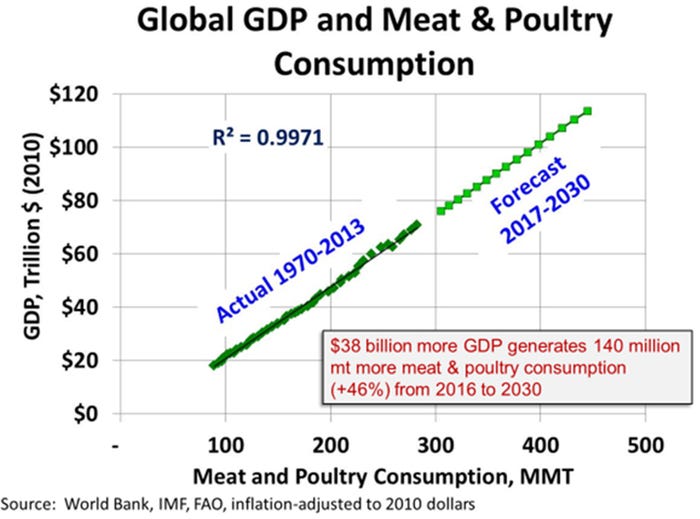
In conclusion, these last three charts may be the most important amalgamation of data that I have ever shared. They come courtesy of Brett Stuart from Global AgriTrends. Stuart is brilliant and has access to some pithy information; he is generous enough to allow me to share this information with you.
The first is the historical trend of world gross domestic product and the best guess of what the curve to 2030 looks like. This is pretty compelling as the consistency of the data and the forward look would appear to be sane.
The second demonstrates the correlation between global GDP and meat consumption. For those of you who remember your college statistics, these R-squared values indicate a highly correlated relationship between world GDP and the quantity of meat demanded. This is a tide that raises all ships — beef, pork and poultry.
The last graph ties it all together. If you believe the first graph from the International Monetary Fund, the World Bank, etc. — and — you believe the historical trend of meat demand is a good proxy for the future, then you are left with a nearly impossible situation. The world will demand more meat in the next 10-15 years than we are probably able to supply. You may want to read that again. Those of us involved in the production side of animal agriculture have an incredibly bright future. You are exactly where you need to be if this data play out. The future profitability of our industry looks great.
Please contact me at [email protected] or 515-268-8888 if anything needs clarification.
Comments in this column are market commentary and are not to be construed as market advice. Trading is risky and not suitable for all individuals.
About the Author(s)
You May Also Like


