How much is an hour of your time worth?
It is impossible to capture all $10 per hog, but taking one extra hour to select and load the hogs could mean $1-$5 more per hog in income.
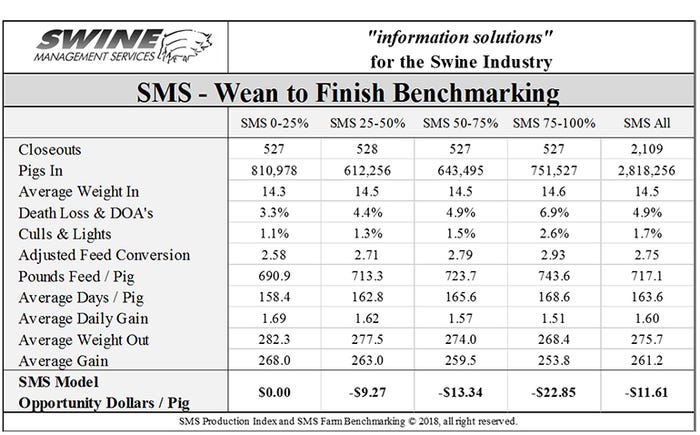
The model we built into the Swine Management Services Carcass and Loading Evaluations program says the average market hog is marketed $10 under its potential (Picture 1). We calculate a cash flow for each individual carcass using a set of standard market prices, pig cost, feed cost, etc., so we can compare changes over time without having to worry about the influence of the commodity prices. We then compare the calculated cash flow to the SMS model cash flow per pig and come up with “opportunity dollars per head”.

We store the supervisor (loader), grower, load/cut number and pig flow with each carcass, giving us the ability to evaluate each area separately.
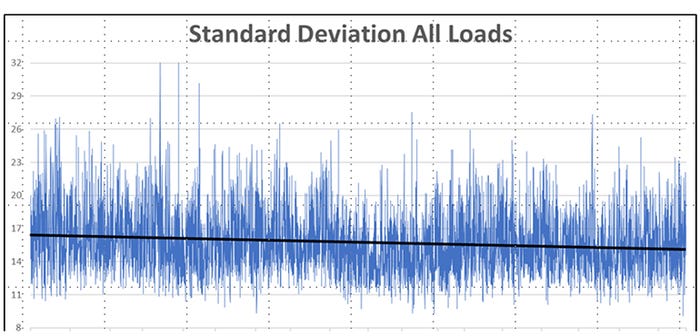
We use the standard deviation of each load to monitor the variation in the carcass weights on each load. A standard deviation of 13 means approximately 95% of the carcasses are within a 50-pound carcass range. A standard deviation of 21 means approximately 95% of the carcasses are within a 90 range. Chart 1 shows the standard deviation for a sampling of the loads in the SMS dataset.
We used the SMS Growing Pig Benchmarking database and the SMS Carcass database to model the performance of the different loads/cuts. We selected two different packers and 2-plus million carcasses for this example.
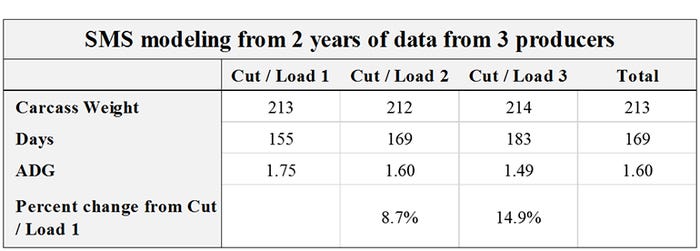
Table 1 shows that the average daily gain at 1.60 for the 2.8 million pigs. Modeling the 2 million individual carcasses we have in our carcass database shows that the first cut/load goes out at a 1.75 average daily gain, the second cut/load goes out at a 1.60 ADG and the last cut/load goes out at 1.49 ADG (Table 2). What is causing the last pigs out to grow 14.9% slower?
Are you doing everything you can to ensure that the pigs are performing to their potential and to ensure that you are able to minimize the variation of performance in groups and across groups?
Things to evaluate
• Stocking density
• Starting procedures
• Daily walk-through procedures
• Proper diets and changing diets at the proper weight
• Water quality, quantity and type of water
• Feeder type, condition, number of spaces and width of each space
• Ventilation set points, cubic feet per minute and evenness in building
• Summer cooling
• Use of hospital pens
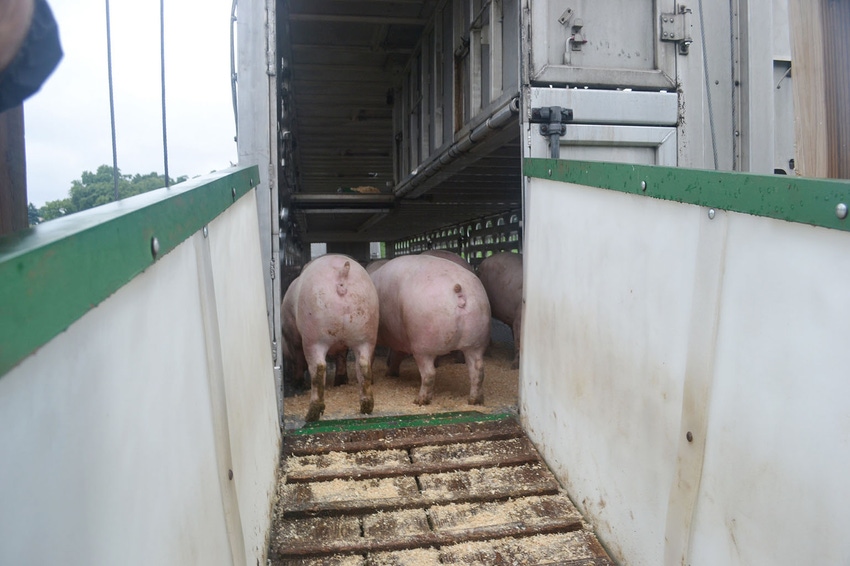
• Put the right pigs on the truck to market
It is impossible to capture all $10 per hog, but taking one extra hour to select and load the hogs could mean $1-$5 more per hog in income.
Sow housing study meetings at World Pork Expo
SMS and the University of Nebraska are working together on an extensive sow housing study. We will be hosting a 15-minute information session followed by question and answers 10 a.m. and 2 p.m. on June 6-7 during the World Pork Expo. These sessions will be held in our tent, located at SV1607 which is southeast of the Varied Industries Building.
This study is open to all farms in the United States and Canada that have been operating for at least three years and using the same housing system for one year. There is an extensive survey to fill out as well as submitting your production data file.
If you are interested in participating in this project, contact Benny Mote at 402-310-9878 or Valerie Duttlinger with Swine Management Services at 812-430-5969. All data must be submitted by Aug. 1 to participate in this study.
If you will be attending the World Pork Expo, we would love to have you stop by our tent, and tell us what you would like to see in future columns.
SMS Production Index
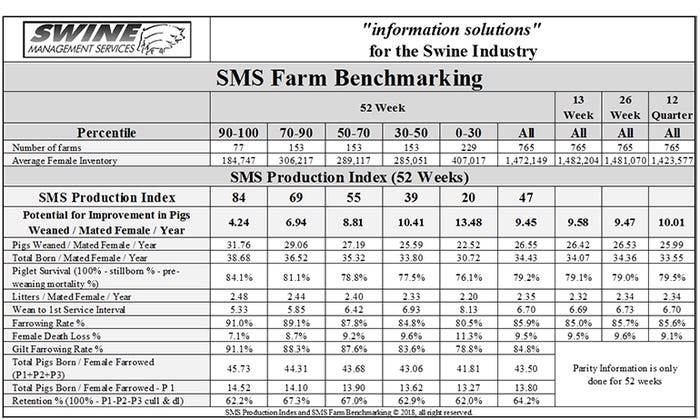
Table 3 provides the 52-week rolling averages for 11 production numbers represented in the SMS Production Index. The numbers are separated by 90-100%, the 70-90%, the 50-70%, the 30-50% and the 0-30% groups. We also included the 13-week, 26-week and 12-quarter averages. These numbers represent what we feel are the key production numbers to look at to evaluate the farm’s performance.
If you have questions or comments about these columns, or if you have a specific performance measurement that you would like us to write about or if your farm would like to be part of the SMS Benchmarking databases, contact Mark Rix, Ron Ketchem or Valerie Duttlinger.
At SMS, our mission statement is to provide “Information solutions for the swine industry”. We feel with the creation of different SMS Benchmarking databases for all production areas we now have more detailed information to share with the swine industry.
We enjoy being a part of the NHF Daily team. Previous columns can be found at NationalHogFarmer.com.
About the Author(s)
You May Also Like

