How does your farm get in the top 20%?
Farms will continue to improve production, drive costs lower and improve revenue. Where do you need to improve?
August 16, 2017

By Kent Bang, Compeer Financial Vice President — Swine Lending
Our team at Compeer Financial has talked about benchmarking and gaining an understanding of where your farm or farms are relative to the competition. Making comparisons on a given characteristic is relatively easy if you have access to databases that compile farm production numbers. The Iowa State University profit model has been a long-standing benchmark for cost and revenue based on average daily markets for Iowa. We used the data to put together an overall picture of financial position of the industry and macro trends in financial parameters of the industry.
Understanding these measures is important for every farm for several reasons. First is one of continuous improvement. Understanding production and financial trends are critical for understanding which area is lagging (relative to peers) and should receive first priority. Understanding how your farm compares is also critical in resource allocation. It should help you determine if available resources should be allocated on expansion, as many are going through today, or allocated to improving operations and performance with a goal of becoming part of the top 20%.
Having data on how your farm compares on a production level, revenue and cost standpoint, and financial position are all vital for operational improvement. For this column I want to focus on the revenue and cost piece, but all three are critical to overall management of the business.
For years I have used the ISU model for these comparisons. They made some changes to their model in 2014, impacting what these numbers represent from a cost perspective. The history goes back many years where the model, from a cost perspective, represented the top 50% of farms, but over the past two to three years, I believe it represents the top 20-25% of farms. Cost of production trumps production performance. We have many clients who would be “average” for production, but excel when you look at cost of production.
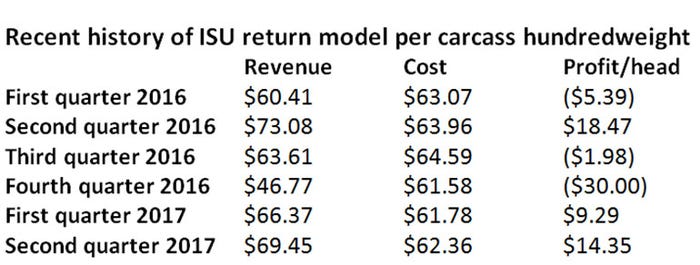
Reviewing the numbers from the ISU model for 2016 and year-to-date 2017 gives a good indication of what the top 20% are accomplishing for profitability. When I analyze the ISU model it’s generally without regard for the manure credit that is a line item on the returns. The reason is that most will either receive little revenue over the cost of application, or — more likely — allocate that back to the crop operation versus the pork production enterprise. This line item amounts to $2.50 to $4 per head on the model.

Getting to the top 20% is a great goal for any farm and understanding the key areas to work on improving is critical. It was Zig Ziglar, a business motivation speaker in the ’80s and ’90s, who said: “You can’t hit a target you cannot see and you cannot see a target you do not have.”
Farms will continue to improve production, drive costs lower and improve revenue. Where do you need to improve?
You May Also Like


