Hog producers see continued profits
Will the current export picture remain through the rest of the year?
August 16, 2021
It’s still demand! But supply is a bit wonky, too. And the result is continued profits for hog producers.
I’ve started columns a lot worse than that, so I’ll take this one in a heartbeat.
June’s export data from USDA confirmed what weekly data has been telling us for some time: Exports have slowed relative to recent months. The good news is that they were higher than in June 2020 and are higher year-to-date. But there are a lot of “beware of year/year comparison” caveats still in play. Let’s explore.
June U.S. pork exports to all destinations amounted to 563.8 million pounds carcass weight equivalent. That figure is a record for June but is 18% lower than last month, even as U.S. pork production was 8.9% larger in June versus May. The 563.8 million pounds was also 9.4% larger than one year ago, but much of the large production level of June 2020 – the largest ever for June at 2.4 billion pounds – was devoted to re-stocking retail pipelines depleted by large purchases and limited supplies in April and May 2020. It’s no surprise that exports suffered.
So, the 563.8 million pounds still represents good performance by U.S. export markets, but we just have to be careful about year-on-year comparisons. I’ll be glad when September gets here, and I can stop bringing up that topic. By September 2020, U.S. hog and pork flows were pretty much back to normal.
The key number from here on in is whether the U.S. pork industry can keep ahead of the 2020 pace for year-to-date sales. As of June 30, that figure stands at 3.833 billion pounds carcass equivalent, 0.9% larger than one year ago. But there is much disagreement on where this figure may go by December 31.
Last week’s August “World Supply and Demand Estimates” report from USDA revised forecasts of production and total domestic pork supply more-or-less to levels that I had already expected. But the WASDE still has 2021 pork exports at 7.409 billion pounds, 1.8% higher than last year. I don’t know of anyone else that is quite that optimistic for the remainder of 2021, including us with an annual total just over 7 billion pounds. The difference is important as it accounts for over one pound per person (roughly 2%) of domestic per capita pork availability/disappearance/consumption.
The key is – you guessed it – China. In mid-July, I had resigned myself to accept that China had, to a great extent, recovered from African swine fever (ASF) and that the renewed horror stories of last winter’s ASF resurgence had been overblown. China’s government said so, and more importantly, Chinese piglet and market hog prices were lower and still falling, indicating ample supplies were available.
Since then, more anecdotal evidence has said, “not so fast, my friends!” Several reports have sales of feed and other supplies down sharply. Others have weights of animals up significantly suggesting that any supply increase is not driven by larger numbers of hogs. Most believe lower numbers are coming in October and beyond.
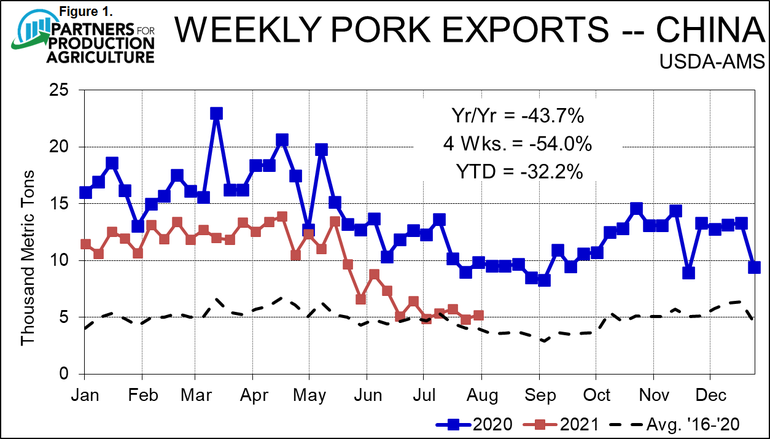
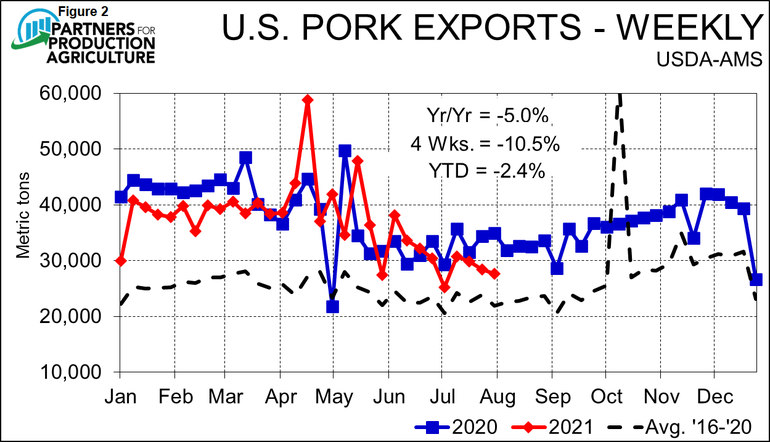
Honestly, I do not know what to believe, but I do know that China’s needs are important to the economic well-being of U.S. producers. China’s weekly imports of U.S. pork have fallen sharply since early May (Figure 1) and now are running near 5,000 MT per week. That decline has dragged total U.S. weekly esports below year-ago levels (Figure 2) in spite of colossal growth to Philippines, strong recent growth to Mexico and good growth to Japan, S. Korea and Canada. Readers should note that Mexico has once again taken the top spot in the ranks of U.S. pork markets year to date, so the export picture is still good. But will it be good enough?
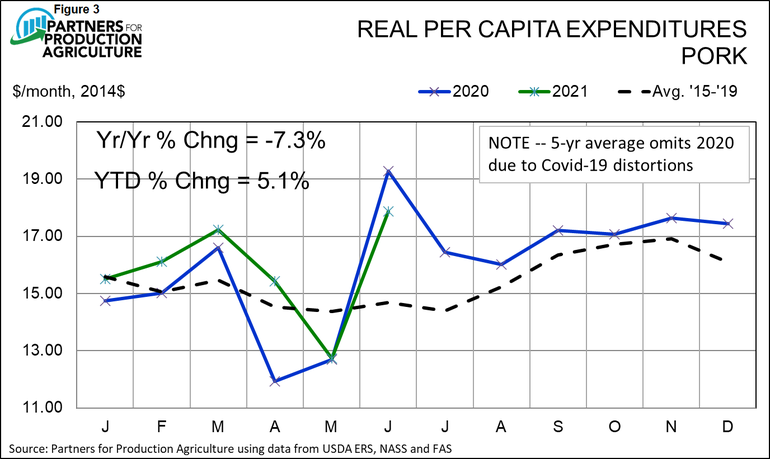
Domestic demand was 7.3% lower, year-on-year, in June, but, again, one must consider the condition of demand last June. Retail prices had not begun to rise much, and per capita consumption was sharply higher as pork packing plants came back to full capacity in an effort to process backed up hogs. Real per capita expenditures (RPCE) for June 2020 were record high at $19.28 (2014 dollars). This year’s figure of $17.87 (2014 dollars) is the fourth highest on record, so, though down from last year, June demand was nothing to sneeze at. Year-to-date pork RPCE is still 5.1% higher than last year through the end of June, indicating very strong pork demand for the year. It is clear Figure 3, June’s exceptional demand situation and even a normal path of pork demand for the rest of the year suggest that we may well be able to continue this beneficial situation!
Export and domestic pork demand join to form the demand for wholesale pork. Clearly that, too, has been strong this year resulting in robust cutout values. USDA’s estimated cutout value increase six straight weeks from July 3 through August 7, gaining $13.34, or 11.9%, at a time of year when it usually goes sideways at best. It did decline slightly last week but still stands at $123.13.
Demand is the primary but not sole driver of that increase. FI slaughter has run 2.8% lower than my forecasts since June 1 based on past USDA pig crops and pig imports from Canada. It has been 3.5% below levels indicated by June 1 USDA market hog inventories relative to 2019 levels (since 2020 levels were so messed up by COVID disruptions). My best guess is that the shortcomings are related to increased death loss during the winter months when we heard of significantly larger impacts of PRRS – even if the incidence was not, as indicated by University of Minnesota data, significantly higher.
The question now is how long will these shortfalls persist? Given the anecdotal resurgence of damaging PRRS outbreaks into the spring and early summer, I think it may indeed persist into fall. I hope the September “Hogs and Pigs” report provides us some new – and more accurate – insights.
Source: Steve Meyer, Partners for Production Agriculture, who are solely responsible for the information provided, and wholly owns the information. Informa Business Media and all its subsidiaries are not responsible for any of the content contained in this information asset. The opinions of this writer are not necessarily those of Farm Progress/Informa.
About the Author(s)
You May Also Like


