Assessing domestic pork demand in 2023
Demand weakness not unique to a particular pork product nor to pork as other species-industries are experiencing challenges as well.
December 11, 2023
By Glynn Tonsor, Kansas State University
The U.S. hog and pork markets are complex and driven by a host of factors. Most active in production appreciate connections across seedstock, farrowing, nursery, finishing and processing sectors. A number of public reports available to the industry align with these production sector connections and often provide head count or volume information that helps characterize supply conditions.
What is equally important to appreciate, yet arguably less tracked and understood is demand. As 2023 concludes, this is of elevated importance given the industry continues to operate under challenging financial conditions. This article seeks to provide additional insight from multiple information sources in hope this increases understanding of consumer demand forces that undermine the industry’s adverse situation.
First, let’s assess wholesale-level pork demand in November 2023 versus prior year, November situations. The wholesale pork sector is a key intermediary in the industry’s farm-to-fork chain helping connect consumers to producers. Volumes of market hogs harvested and processed into primals, and later to consumer-ready products, are reported by USDA in the form of load counts conveying current wholesale market supply information.
Meanwhile USDA reported values, both at the carcass composite level and separately for six primals, provide estimates of current market valuations placed on wholesale pork. These valuations reflect net demand signals from domestic retail (at-home consumption), domestic food service (away-from-home consumption), and export (foreign consumption) forces relative to available supplies.
Patterns in the LM_PK602 report (USDA National Pork Report, FOB Plant) reveal values for loads and values conveying wholesale pork demand trends. Here we use scatterplots to reveal important patterns. Namely, any time we observe both lower volume (loads) and price (inflation-adjusted cutout values) outcomes in a market we have clear evidence of demand decline.
Unfortunately, this accurately depicts the wholesale pork market for November 2023 versus November 2022 (as well as November of 2022 versus November 2021). This can be seen as 2023 is “down and left” of 2022 in Figure 1 and 2022 is “down and left” of 2021 (hence the red text on 2022 and 2023). Conversely, wholesale pork demand in November 2021 was clearly stronger than in November of 2020 as more loads sold at a higher price. Before going further, it is not surprising that stronger wholesale pork demand in November of 2021 corresponded with better industry profitability than characterized November of 2022 or 2023.
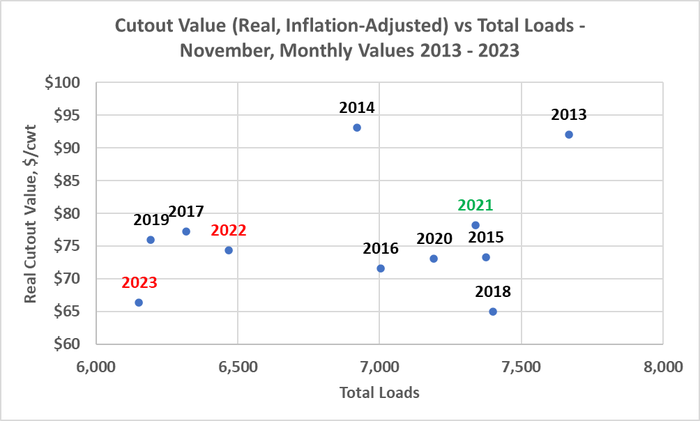
Tonsor. Figure 1. Pork Cutout Value (Real, $/lb) vs. Total Loads, November monthly values (2013-2023).
Not only is the composite cutout value lower in November 2023 than in November 2022, a narrower assessment shows the primal values for loin, picnic, rib, ham and belly are also lower. This leaves primal butt values as the only category that increased year-over-year. Looking further back reveals lower November 2022 primal values for loin, butt, rib and belly (not picnic and ham) compared to November 2021. A summary point here is wholesale pork demand has been weakening for some time and this is not isolated to any single primal category but rather reflects a broader challenge.
As noted earlier, these wholesale level observed trends are the net of domestic retail, domestic food service, and export demand forces. To better understand the domestic retail situation (which we have the best available data on), and help see how beef and chicken are also faring in comparison to pork, we look deeper at patterns appearing in Circana (formerly IRI) scanner data. Figures 2-4 are annual scatterplots depicting quantity-price (inflation-adjusted) relationships for retail pork, beef, and chicken respectively. The 2023 projections reflect scaling up currently observed 44-weeks of data available for 2023 up to what is expected for all 52 weeks.
The clear take-home point from Figure 2 is retail pork demand has declined notably in 2023 versus both 2022 and 2021 as in both cases we observe lower volume at a lower sales price. Current projections for 2023 are retail pork volume to be 6% lower and inflation-adjusted price to be 4% lower leading to a 10% decline in retail dollars compared to 2022. Also note that 2020 was a clear case of demand growth vs 2019 (higher volume & higher sales price). Demand conclusions for 2021 versus 2020, and 2022 versus 2021, depend on a presumed own-price elasticity of demand as there are price-quantity tradeoffs in those cases (as is common to periods where there is not obvious demand growth or contraction).
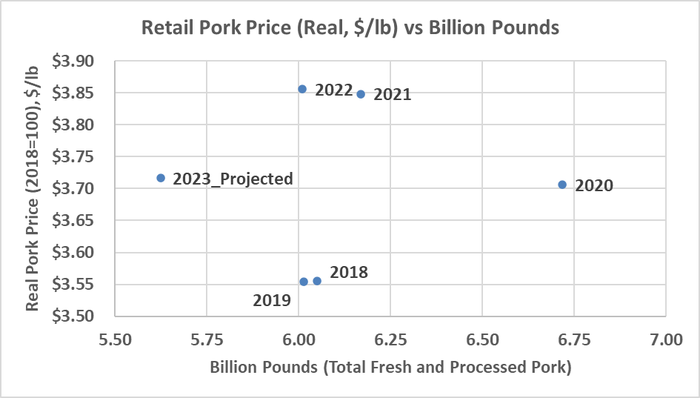
Tonsor. Figure 2. Retail Pork Price (Real, $/lb) vs. Volume (Billion lbs), 2018-2023 Projected.
We can make a similar assessment of patterns in retail demand for beef and chicken. Current projections for 2023 are retail beef volume to be 3% lower and inflation-adjusted price to be 1% lower leading to a 3% decline in retail dollars compared to 2022 (Figure 3).
Meanwhile, current projections for 2023 are retail chicken volume to be 2% higher and inflation-adjusted price to be 4% lower leading to a 1% decline in retail dollars compared to 2022 (Figure 4). Combined this suggests retail demand struggles being experienced in the pork industry are not isolated and rather are multi-species in nature.
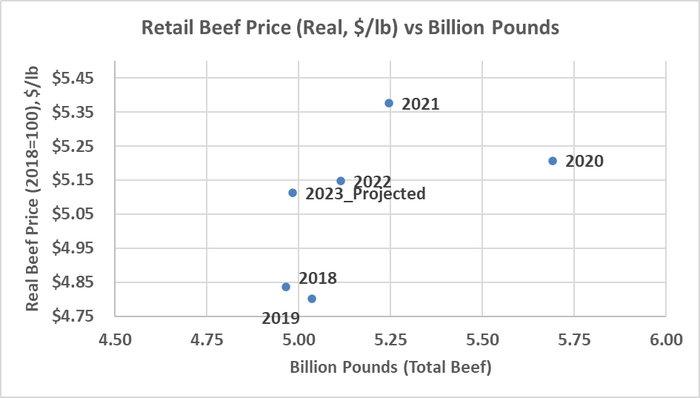
Tonsor. Figure 3. Retail Beef Price (Real, $/lb) vs. Volume (Billion lbs), 2018-2023 Projected.
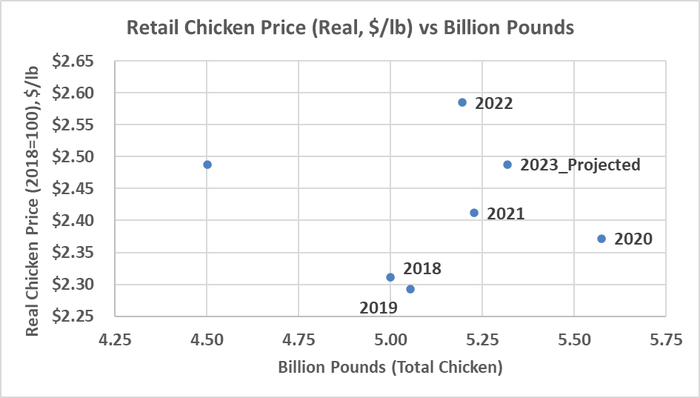
Tonsor. Figure 4. Retail Chicken Price (Real, $/lb) vs. Volume (Billion lbs), 2018-2023 Projected.
Finally, we use some available pieces of use Meat Demand Monitor information to more finely assess the current U.S. consumer situation. Examining 3rd quarter (July-September) data reveals on average U.S. residents report spending 4.5% more on food at-home and 3.4% more on food at home in 2023 than in 2022. Meanwhile the average income increase reported for quarter 3 was 0.5%. Observing food expenditures to outpace income growth is consistent with widely noted domestic meat demand challenges.
Looking further at protein values information reported by the MDM reveals the role of price in protein purchasing decisions was elevating in 2022. Narrowly, in the third quarter of 2022, 50% indicated price was a top consideration, 29% considered price an intermediate factor, and 21% signaled price was a low-ranking purchasing determinant. This contrasts with the third quarter of 2021 where 46% said price was a top consideration, 31% placed price in the intermediate grouping, and 24% indicated price was a low-ranking factor.
The point is, by the third quarter of 2022 we observed consumers signaling price was growing in importance. This has continued with the third quarter of 2023 having 49%, 31% and 20% placing price in the most, intermediate and least important categories respectively. Not surprisingly, the importance of price in protein purchasing decisions has grown in recent years.
A refined example of product level impacts from the evolving consumer situation was included in the October 2023 MDM base report. The role of financial sentiment on pork chop, beef steak and chicken breast consumption in the past month was summarized in the report’s final figure. Unfortunately, in October 2023 only 21% reported their household finances had improved from the prior year with 35% saying their finances have worsened. As shown in Figure 5 here, pork chop and beef steak consumption rates are notably lower for those indicating their finances have eroded. Conversely, there is less of an impact for chicken breast consumption. Combined this aligns with the three scatterplots above, informed by scanner data, and different consumer retail behavioral adjustments to-date in 2023.
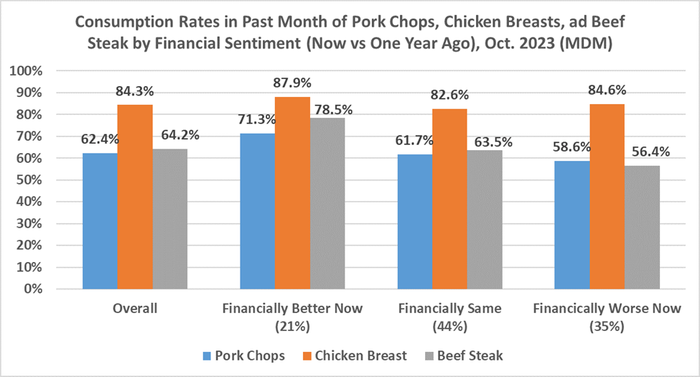
Tonsor. Figure 5. Impact of Financial Sentiment on Consumption Rates, Meat Demand Monitor (October 2023).
As a final summary statement, it is always important to appreciate the role of both supply and demand underpinning U.S. hog-pork markets. This importance is further elevated in times of industry strife and associated elevated emotions where data-based insights are arguably most needed. This article provides clear evidence from multiple, complimenting data sources that demand for U.S. pork has weakened. This demand weakness is not unique to a particular pork product category nor unique to pork as other species-industries are experiencing challenges in 2023 as well. Hopefully this update helps industry stakeholders better appreciate factors underlying the current situation and subsequently aides decision-making as we move into 2024.
You May Also Like
