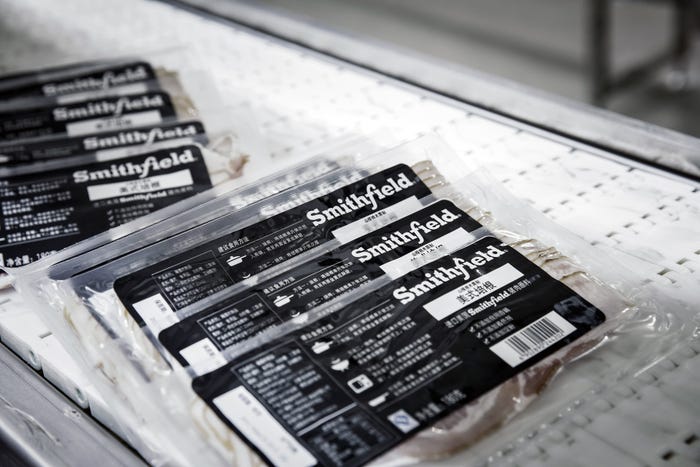
Producer output and packer capacity must coincide.
To function efficiently, the U.S.-Canadian pork sector must be a well-tuned interaction of mainly independent businesses. Input suppliers, producers, packers, processors, retailers and foodservice operators must all be “on the same page” in order to deliver to consumers the correct quantity of pork products with the right characteristics in a timely manner.
Stated more succinctly — producers and packers had better be in step with demand! The relationship of producer output and packer capacity is critical to accomplishing this task and maintaining producer prices at equitable levels.
Packing Capacity Benchmark
Prior to 1980, the U.S. pork packing sector was comprised of widely scattered, mainly multi-species, multi-story plants that usually operated just one shift daily. Those characteristics made plants quite flexible and allowed them to easily handle large seasonal variation of hog supplies. At times, fourth-quarter slaughter represented 30% of the year's total.
But those plants also reflected old technology and business models that left them vulnerable to innovative competition.
The competitive balance of the meat industry began to change dramatically by the 1970s. Chicken had gone from being a by-product of the egg business and a relative luxury, as President Hoover promised “a chicken in every pot,” to supplanting pork as a low-cost source of meat protein.
Pressure on pork packer margins and relatively lucrative labor contracts at the major packers of the day — Wilson, Swift, Hormel and Morrell — set off a period of labor unrest that was to open the door for new competitors.
Enter IBP. Iowa Beef Processors had already revolutionized beef slaughter and fabrication with low-cost, frequently non-unionized, efficient operations and boxed beef products. IBP promised to do the same in pork slaughter and fabrication, putting greater competitive pressure on established pork packers.
The advent of species-specific, single-story, high-throughput pork plants began a long period of tight margins that rationalized pork slaughter capacity by driving old, inefficient, poorly-located plants out of business.
That rationalization process collided with higher hog output for the first time in the fall of 1994, when cyclically higher hog numbers and diminished slaughter capacity caused delays in orderly marketings. Live hog prices fell to disastrous levels in the mid-$20s.
The occasion, though, did provide one positive outcome: For the first time in virtually anyone's memory, we had a clear idea of the total capacity of U.S. pork slaughter facilities. A benchmark had been established. Little did we know how important this concept would become just four years later.
Importance of Packing Capacity
The packing-processing sector performs the absolutely necessary function of transforming live hogs into wholesale and retail cuts. It cannot be quickly replaced, and must be paid to perform those services.
Furthermore, no one in the packing-processing sector decides how much to produce. That decision rests solely with the people who breed and farrow sows.
For the pig-pork system to work well, packers must have enough capacity to slaughter and process whatever number of pigs producers can deliver at near optimal market weights in a given time period. If that number nears the capacity of packing facilities, packers' marginal cost (total cost added by the last unit processed) increases dramatically.
Since consumer prices are based, in the short run, on demand and not costs, the increase in packer marginal cost is taken out of the price paid for pigs. Obviously, this can spell potentially disastrous results for producers.
Figure 1 shows the strong negative relationship that existed between slaughter capacity utilization and hog prices from 1994 to 2003. High utilization in the fall of 1994, 1998 and 2002 resulted in low hog prices. Low utilization in 1996-1997 and the summers of 2000 and 2001 resulted in high prices. Note that utilization rates of over 100% in this graph are the result of computing average daily slaughter, using monthly slaughter and the number of slaughter weekdays in a month. The extra slaughter is accomplished by operating extra weekday hours and Saturdays.
This negative relationship between these two variables fell apart to some degree in 2004 because of a huge increase (12%) in hog demand. That increase was the result of higher domestic pork demand, record levels of pork exports and, at least from July 2004 through June 2005, tight packer margins. It appears that the negative relationship has reasserted itself since mid-2005, as capacity utilization has increased and hog prices have fallen.
U.S., Canadian Capacity
U.S. and Canadian slaughter capacities, by plant and company, for 2004 through 2006 are shown in Tables 1-3. Note that Canadian capacity is weekly, while U.S. capacity is daily. Right-justified names in the company column (i.e. Morrell, Farmland) represent companies purchased by the current owner, whose name is left-justifed (i.e. Smithfield) in that same cell.
No expansions of U.S. capacity are anticipated this year. But some capacity increases are quite subtle. Packers often increase throughput without adding plants, plant size or equipment, simply by developing new operational techniques. In fact, the current estimate of U.S. capacity is likely low for this very reason.
Need evidence? Consider the fall of 2004 (Figure 1). Very high-computed capacity utilization — even higher than that of the fall of 1998 — was not accompanied by extremely low prices. This probably occurred because our estimate of capacity is a bit too low, and thus, our computed utilization rate is a bit too high.
Packers aren't necessarily lying about their capacity; they just have every incentive to operate a plant in a manner that increases its output, and they don't always make those changes public.
According to the Canadian Pork Council, Canada's packing sector will grow this year as Olymel completes the expansion of its Red Deer, Alberta plant; the RDA plant in Quebec opens; and two other plants expand slightly.
Plans are in place for significant capacity growth in both the United States and Canada in 2007 and 2008. Table 4 shows these increases, including new plants in Moline, IL, and Winnipeg, Manitoba. The combined increase of 32,850 head/day would represent a 6.4% increase of current combined capacity.
What Does It All Mean?
These data suggest that U.S.-Canadian packing capacity will likely be sufficient for the foreseeable future. Higher U.S. hog supplies and relatively constant Canadian output through the fall of 2007 will increase utilization rates, but likely will not drive them to the problematic levels of years past.
If all planned capacity expansions actually occur, the growth rate of slaughter capacity will be higher than the growth rate of hog production through 2008. This will drive capacity utilization rates lower, putting positive pressure on hog prices and negative pressure on packer margins.
The latter raises the question: “What plant(s) may close?”
The U.S. list provides no clear answers. The plants that are usually considered suspect (Sioux Falls, SD; Monmouth, IL; Louisville KY;) have either seen major modernizing investments, or owe their owners little in terms of fixed costs.
While margins may get tight over the next two years, they are not likely to fall short of variable costs for any long period of time. Consequently, these plants will likely continue to operate. There simply isn't much vulnerable capacity in the United States.
On the other hand, Canada presently has excess slaughter capacity, and the planned expansions will increase that excess.
A number of Canadian plants are older and, at least by U.S. standards, less efficient. The current reduction of the Canadian sow herd, output difficulties related to porcine circovirus-associated disease (PCVAD), and a Canadian dollar that creeps closer and closer to par with the U.S. dollar will put economic pressure on the weaker plants.
The biggest risk for pork producers in both the United States and Canada is that plant closures will be delayed long enough for any reduction in capacity to again coincide with a significant increase in hog numbers. When and if that happens, we could see a repeat of the '98 hog price disaster.
Should the planned sow herd expansions occur, some believe that another 100,000 to 150,000 sows will be added in the United States. There is a greater risk of such a replay. The pork sector simply will not work in the long run with production and packing sectors whose sizes do not match.
Fall 2004 | Fall 2005 | Projected Fall 2006 | ||||||
---|---|---|---|---|---|---|---|---|
Rank | Company | City/State | Plant | Co. Total | Plant | Co. Total | Plant | Co. Total |
1 | Smithfield Foods (Smithfield, VA) | Tar Heel, NC | 32,000 | 32,000 | 32,000 | |||
Smithfield, VA | 7,800 | Closed | Closed | |||||
Gwaltney, VA | 9,500 | 10,800 | 10,800 | |||||
Morrell | Sioux Falls, SD* | 14,400 | 14,400 | 14,400 | ||||
Sioux City, IA | 14,500 | 14,500 | 14,500 | |||||
Farmland | Crete, NE | 10,400 | 10,400 | 10,400 | ||||
Denison, IA | 9,200 | 9,200 | 9,200 | |||||
Monmouth, IL | 9,000 | 106,800 | 9,000 | 100,300 | 9,000 | 100,300 | ||
2 | Tyson Foods (Dakota Dunes, SD) | Waterloo, IA | 19,200 | 19,200 | 19,200 | |||
Logansport, IN | 14,500 | 14,500 | 14,500 | |||||
Storm Lake, IA | 14,500 | 15,000 | 15,000 | |||||
Col. Junction, IA | 9,800 | 9,800 | 9,800 | |||||
Madison, NE | 7,500 | 7,500 | 7,500 | |||||
Perry, IA | 6,800 | 72,300 | 6,800 | 72,800 | 6,800 | 72,800 | ||
3 | Swift (Greeley, CO) | Worthington, MN | 17,500 | 17,500 | 17,500 | |||
Marshalltown, IA | 18,500 | 18,500 | 18,500 | |||||
Louisville, KY | 10,000 | 46,000 | 10,000 | 46,000 | 10,000 | 46,000 | ||
4 | Excel (Wichita, KS) | Beardstown, IL | 18,000 | 18,000 | 18,000 | |||
Ottumwa, IA | 18,000 | 36,000 | 18,000 | 36,000 | 18,000 | 36,000 | ||
5 | Hormel (Austin, MN) | Austin, MN | 18,000 | 18,000 | 18,000 | |||
Fremont, NE | 8,800 | 26,800 | 10,500 | 10,500 | ||||
Clougherty | Los Angeles, CA | 7,300 | 7,300 | 7,300 | 35,800 | 7,300 | 35,800 | |
6 | Prem. Std. (Kansas City, MO) | Milan, MO | 7,300 | 7,300 | 7,300 | |||
Clinton, NC | 10,000 | 17,300 | 10,000 | 17,300 | 10,000 | 17,300 | ||
7 | Seaboard (Shawnee Mission, KS) | Guymon, OK | 16,000 | 16,000 | 16,000 | 16,000 | 16,000 | 16,000 |
8 | Indiana Packers Corp. (Delphi, IN) | Delphi, IN | 12,500 | 12,500 | 12,500 | 12,500 | 12,500 | 12,500 |
9 | Hatfield Quality Meats (Hatfield, PA) | Hatfield, PA | 10,200 | 10,200 | 10,200 | 10,200 | 10,200 | 10,200 |
10 | Sara Lee (Cincinnati, OH) | West Point, MS | 6,200 | 6,200 | 6,200 | 6,200 | 6,200 | |
11 | Triumph Foods (St. Joseph, MO) | St. Joseph, MO | 8,000 | 8,000 | 8,000 | 8,000 | ||
12 | J.H. Routh (Sandusky, OH) | Sandusky, OH | 4,200 | 4,200 | 4,200 | 4,200 | 4,200 | 4,200 |
13 | Meadowbrook Farms (Rantoul, IL) | Rantoul, IL | 4,000 | 4,000 | 4,000 | 4,000 | 4,000 | 4,000 |
14 | Sioux-Preme (Sioux Center, IA) | Sioux Center, IA | 3,500 | 3,500 | 3,500 | 3,500 | 3,500 | 3,500 |
15 | Greenwood (Greenwood, SC) | Greenwood, SC | 3,000 | 3,000 | 3,000 | 3,000 | 3,000 | 3,000 |
16 | Fisher Ham and Meat (Spring, TX)** | Spring, TX | 1,500 | 1,500 | 1,500 | |||
Navasota, TX | 500 | 2000 | 500 | 2,000 | 500 | 2,000 | ||
17 | Spectrum Meats (Mount Morris, IL) | Mount Morris, IL | 1,600 | 1,600 | 1,600 | 1,600 | 1,600 | 1,600 |
18 | Yosemite Meat (Modesto, CA) | Modesto, CA | 1,500 | 1,500 | 1,500 | 1,500 | 1,500 | 1,500 |
19 | Leidy's (Souderton, PA) | Souderton, PA | 1,400 | 1,400 | 1,400 | 1,400 | 1,400 | 1,400 |
20 | Vin-Lee-Ron (Mentone, IN)** | Mentone, IN | 1,100 | 1,100 | 1,100 | 1,100 | 1,100 | 1,100 |
21 | Martin's Pork Products (Falcon, NC)** | Falcon, NC | 1,000 | 1,000 | 1,000 | 1,000 | 1,000 | 1,000 |
22 | Cloverdale Foods (Minot, ND) | Minot, ND | 920 | 920 | 920 | 920 | 920 | 920 |
23 | Verschoor Meats (Sioux City, IA)** | Sioux City, IA | 800 | 800 | 800 | 800 | 800 | 800 |
24 | Peoria Packing (Chicago, IL) | Chicago, IL | 750 | 750 | 750 | 750 | 750 | 750 |
25 | The Pork Company (Warsaw, NC)** | Warsaw, NC | 750 | 750 | 750 | 750 | 750 | 750 |
26 | Independent Meat (Twin Falls, ID) | Twin Falls, ID | 650 | 650 | 650 | 650 | 650 | 650 |
27 | Masami Meat Co. (Klammath Falls, OR) | Klammath Falls, OR | 650 | 650 | 650 | 650 | 650 | 650 |
28 | DeKalb Co. Packing (DeKalb, IL) | De Kalb, IL | 500 | 500 | 500 | 500 | 500 | 500 |
29 | Carleton Packing (Carlton, OR) | Carleton, OR | 375 | 375 | 375 | 375 | 375 | 375 |
30 | Lowell Packing (Fitzgerald, GA) | Fitzgerald, GA | 350 | 350 | 350 | 350 | 350 | 350 |
31 | Parks Family Meats (Warsaw, NC) | Warsaw, NC | 300 | 300 | 300 | 300 | 300 | 300 |
32 | Morris Meat Packing (Morris, IL) | Morris, IL | 200 | 200 | 200 | 200 | 200 | 200 |
33 | Southern Quality Meats (Pontotoc, MS)** | Pontotoc, MS | 130 | 130 | 130 | 130 | 130 | 130 |
TOTAL TOP & LIGHT HOG CAPACITY | 380,875 | 390,775 | 390,775 | |||||
TOTAL SOW AND BOAR CAPACITY | 20,800 | 20,800 | 20,800 | |||||
TOTAL HOG SLAUGHTER CAPACITY | 401,675 | 411,575 | 411,575 | |||||
*2,600 hd/day of capacity is counted for sows. | ||||||||
**These plants mainly slaughter light pigs (total:5,780 head/day). |
Fall 2004 | Fall 2005 | Fall 2006 | |||||||
---|---|---|---|---|---|---|---|---|---|
Rank | Company | City | Province | Plant | Company | Plant | Company | Plant | Company |
1 | Olymel | Vallée-Jonction | Quebec | 35,000 | 35,000 | 35,000 | |||
St-Valerien | Quebec | 38,000 | 38,000 | 38,000 | |||||
Brochu | St-Esprit | Quebec | 15,000 | 27,000 | 27,000 | ||||
Brochu | St-Henri | Quebec | 15,000 | ||||||
Fletchers | Red Deer | Alberta | 45,000 | 148,000 | 60,000 | 160,000 | 80,000 | 180,000 | |
2 | Maple Leaf Foods | Brandon | Manitoba | 45,000 | 45,000 | 45,000 | |||
Burlington | Ontario | 43,500 | 43,500 | 43,500 | |||||
Charlottetown | Prince Edward Island | 5,000 | 5,000 | 5,000 | |||||
Berwick | Nova Scotia | 6,000 | 7,500 | 7,500 | |||||
Lethbridge | Alberta | 6,500 | 6,500 | 6,500 | |||||
Schneider | Winnipeg | Manitoba | 17,500 | 123,500 | 17,500 | 125,000 | 17,500 | 125,000 | |
3 | Quality Meat Packers | Toronto | Ontario | 30,000 | 30,000 | 33,000 | 33,000 | 33,000 | 33,000 |
4 | Abattoir St-Alexandre | St. Alexandre | Quebec | 15,500 | 15,500 | 20,000 | 20,000 | 20,000 | 20,000 |
5 | Du Breton | Rivière-du-Loup | Quebec | 18,000 | 18,000 | 18,000 | 18,000 | 18,000 | 18,000 |
6 | Mitchell's | Saskatoon | Saskatchewan | 18,000 | 18,000 | 18,000 | 18,000 | 18,000 | 18,000 |
7 | Springhill Farms | Neepawa | Manitoba | 18,000 | 18,000 | 18,000 | 18,000 | 18,000 | 18,000 |
8 | Trahan | Yamachiche | Quebec | 12,000 | 12,000 | 15,000 | 15,000 | 15,000 | 15,000 |
9 | Agromex | St-Blaise | Quebec | 10,000 | 10,000 | 12,000 | 12,000 | 13,000 | 13,000 |
10 | Conestoga | Breslau | Ontario | 12,500 | 12,500 | 12,500 | 12,500 | 12,500 | 12,500 |
11 | RDA | Les Cèdres | Quebec | 10,000 | 10,000 | ||||
12 | Britco Export Packers | Langley | British Columbia | 6,000 | 6,000 | 6,000 | 6,000 | 6,000 | 6,000 |
13 | Lucyporc | Yamachiche | Quebec | 3,500 | 3,500 | 4,500 | 4,500 | 4,500 | 4,500 |
14 | Kamouraska | St-Pascal | Quebec | 3,500 | 3,500 | 3,500 | 3,500 | 4,000 | 4,000 |
15 | Trochu Meats | Trochu | Alberta | 3,500 | 3,500 | 3,500 | 3,500 | 3,500 | 3,500 |
16 | J&M Meats International | Warburg | Alberta | 3,000 | 3,000 | 3,000 | 3,000 | 3,000 | 3,000 |
17 | Hébert | Ste-Hélène-de-Bagot | Quebec | 2,500 | 2,500 | 2,500 | 2,500 | 2,500 | 2,500 |
18 | Oronor | Lorrainville | Quebec | 1,000 | 1,000 | 1,000 | 1,000 | 1,000 | 1,000 |
19 | Giroux | East Angus | Quebec | 1,000 | 1,000 | 1,000 | 1,000 | 1,000 | 1,000 |
20 | Sturgeon Valley | St. Albert | Alberta | 1,000 | 1,000 | 1,000 | 1,000 | 1,000 | 1,000 |
West Perth / Newco | Mitchell | Ontario | 5,000 | 5,000 | |||||
Worldwide Pork | Moose Jaw | Saskatchewan | 5,500 | 5,500 | |||||
Best Brand (formerly Forgan) | Winnipeg | Manitoba | 10,000 | 10,000 | |||||
TOTAL WEEKLY CAPACITY | 451,000 | 457,500 | 489,000 | ||||||
Source: Canadian Pork Council |
Fall 2005 & Projected Fall 2006 | ||||
---|---|---|---|---|
Rank | Company | Plant | Plant | Co. Total |
1 | Morrell | Sioux Falls, SD | 2,600* | 2,600 |
2 | Jimmy Dean (Sara Lee) | Newburn, TN | 2,600 | 2,600 |
3 | Johnsonville | Watertown, WI | 600 | |
Momence, IL | 1,350 | |||
Oldham's Sausage | Holton, KS | 600 | 2,550 | |
4 | Pine Ridge Farms | Des Moines, IA | 2,500 | 2,500 |
5 | Pork King Packing | Marengo, IL | 2,000 | 2,000 |
6 | USA Pork Products** | Hazellton, PA | 2,000 | 2,000 |
7 | Abbyland Foods | Curtiss, WI | 1,700 | 1,700 |
8 | Bob Evans Farms | Bidwell, OH | 200 | |
Xenia, OH | 300 | |||
Hillsdale, MI | 300 | |||
Galva, IL | 300 | |||
Owens Sausage | Richardson, TX | 600 | 1,700 | |
9 | Odom's | Little Rock, AR | 1,000 | 1,000 |
10 | Calihan | Peoria, IL | 425 | 425 |
11 | F.B. Purnell Sausage | Simsonville, KY | 400 | 400 |
12 | J.C. Potter (Atlantic Premium Brands) | Durant, OK | 400 | 400 |
13 | Williams Sausage Company | Union City, KY | 400 | 400 |
14 | Dean Sausage | Atalla, AL | 225 | 225 |
15 | Wampler's Sausage | Lenoir City, TN | 200 | 200 |
16 | Gunnoe Sausage | Goode, VA | 100 | 100 |
TOTAL | 20,800 | |||
*Morrell sow capacity is estimated. Sioux Falls plant kills both top hogs and sows. ** USA Pork Products kills 80% boars, 20% butcher hogs. |
New Capacity In: | ||||
---|---|---|---|---|
Company | Plant | 2007 | 2008 | Source of New Capacity |
Triumph Foods (St. Joseph, MO) | St. Joseph, MO | 8,000 | Second shift | |
Moline, IL | 8,000 | New plant, first shift | ||
Trim-Rite (Carpentersville, IL) | Freeport, IL | 4,000 | New plant — break ground Q2-'06, open Q2-'07 | |
Premium Standard Farms | Milan, MO | 2,700 | Expansion — planned opening Q2-'07 | |
Farmland Foods | Denison, IA | 1,150 | Expansion — adding 1,150 hd/day in 2007 | |
TOTAL NEW U.S. CAPACITY | 15,850 | 8,000 | ||
OlyWest (Canada) | Winnipeg, MB | 9,000 | New plant — Olymel, Hytek & Big Sky | |
TOTAL NEW U.S.-CANADA CAPACITY | 15,850 | 17,000 |