SMS 2016 data paint picture of swine herd productivity
Swine Management Services takes a look back at 2016 through production numbers in their database.
January 3, 2017
By Ron Ketchem, Mark Rix and Valerie Duttlinger, Swine Management Services LLC, Fremont, Neb.
It’s hard to believe that another year has come to a close. As we look forward to what awaits in 2017 let’s look back on 2016 and talk about some of the notable things that we saw in the data this year.
Sow death loss
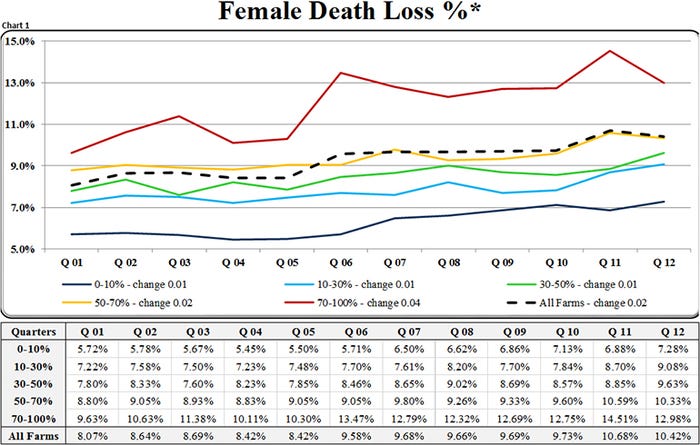
We saw the benchmark database average hit and then pass 10% this year at 10.1% for the last 52 weeks, with the last quarter at 10.4% (Chart 1). Over the last 12 quarters female death loss has increased 2.35%. We believe that there are several causes for the increase. One that has gained national attention is the increase in sow prolapses over the last couple of years. Increasing prolapses appear to be a very complex issue that will take some time to figure out what the cause or causes are and how to lower them.
Another tope concern is an increase in feet and leg soundness problems as more facilities go to some form of loose sow housing. There are some things that can be done on farm to help reduce the feet and leg issues and it starts with how the replacement gilts are selected and handled. As the future of your farm is in the gilts, are they in a nice Cadillac or an old Chevy facility? Making sure the gilts are on good floors with plenty of space is important to reduce injuries. It is important to make sure that the gilts entering the herd are sound at entry. If she is of questionable soundness at entry she isn’t going to make it very long as she ages and carries more weight. Especially in pen settings we are seeing excessive toe growth, there is some trimming that can be done in the farrowing crate that can have a huge positive impact on soundness and reducing injuries. It appears feet and leg soundness it a three-part issue: gilt soundness, nutrition and routine feet maintenance.
Semen quality issues
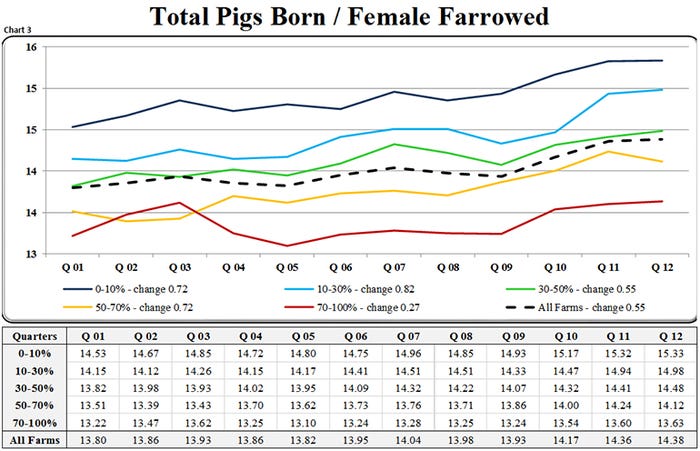
There have been several farms that have dealt with semen quality issues which significantly impacted both the farrowing rate and total born of some farms. The first quarter of this year had the lowest farrowing rate in the last three years at 83.8% (Chart 2) and total pigs born per female farrowed at 13.93 pigs (Chart 3). You will also see in Chart 3 that total born the last four quarters had increased from 13.93 to 14.38 pigs.
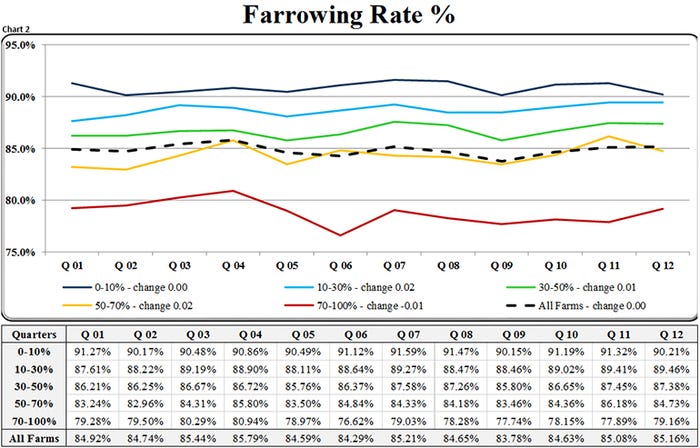
One of the things that we did find through this is related to the number of times that semen is being delivered to your farm really does matter. Those farms that had delivery service three times a week saw minimal effects from this issue compared to those that only had deliveries twice a week.
There have been some bacterial issues this year as well. The effect of that isn’t really known because it is hard to separate that out from the seasonal trends that we see. Are you tracking your matings by batch numbers? This is a great way to really know if it is a semen issue or other issues. There are also a lot of third-party semen evaluation labs available. If you are questioning semen quality, send a sample off. It doesn’t hurt to occasionally submit semen samples for evaluation even if you aren’t questioning the quality.
Stillborns
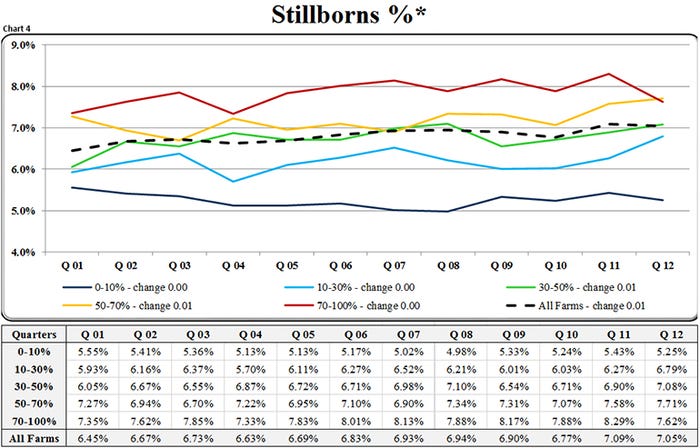
The percent of stillborns per female farrowed (Chart 4) has changed very little over the last three years — going from 6.45% to 7.05% over 12 quarters. However, the stillborns per female farrowed (Chart 5) has risen because of the increase in total born per female farrowed (Chart 3) has gone from 13.80 to 14.38 pigs over that same 12 quarters of time. At 0.99 stillborns per female farrowed for the year there is a significant amount to be gained on most farms in this area.
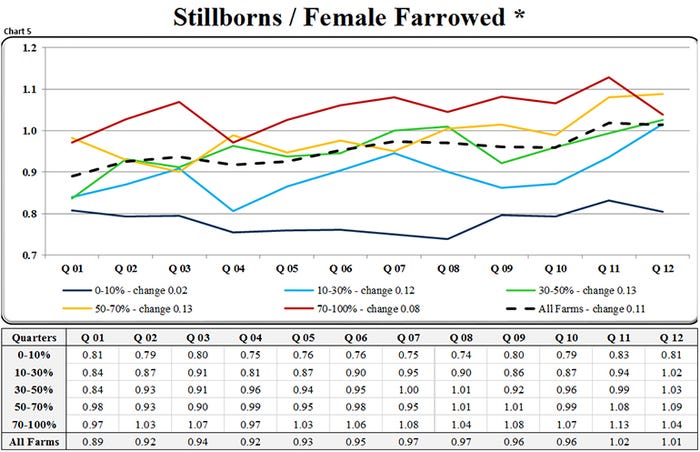
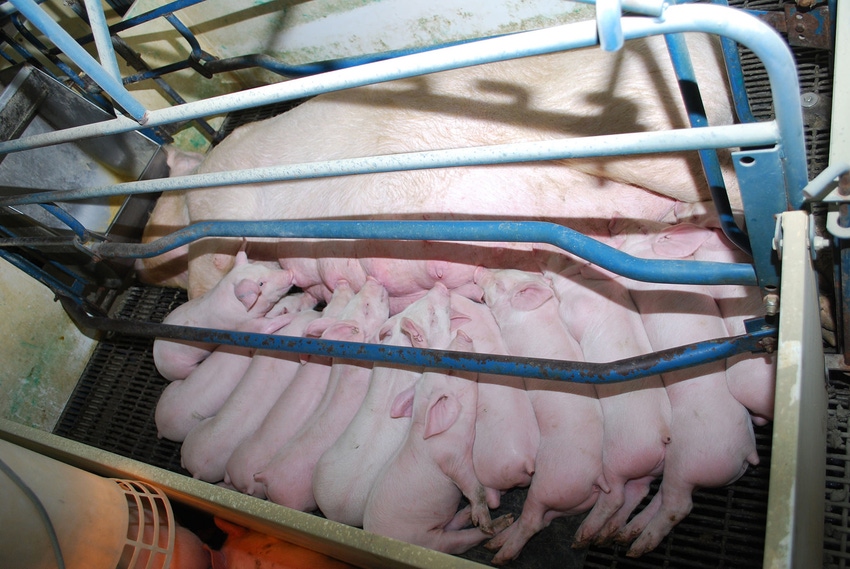
It does not take 24-hour care on farms to capture most of that; however it does take more than eight hours of coverage in farrowing rooms. Start by tracking beginning and ending times on farrowings for a couple of weeks to see when sows are farrowing to help determine what hours sows need to be monitored and assisted. Most sows start farrowing naturally between 11 a.m. and 2 p.m. Is the staff staying around to make sure those sows that are starting at 2 p.m. finish without problems? Are Day 1 pig techs covering too many sows? One person can generally cover 10 to 12 sows that are pigging. The farms in the top 10% for stillborns per litter are sleeving sows frequently, some averaging four to five sleeves per sow per week. Are you aggressive enough in sleeving to save as many pigs as you can?
What are your goals for 2017 to improve pigs weaned per mated female per year?
SMS 52-week numbers
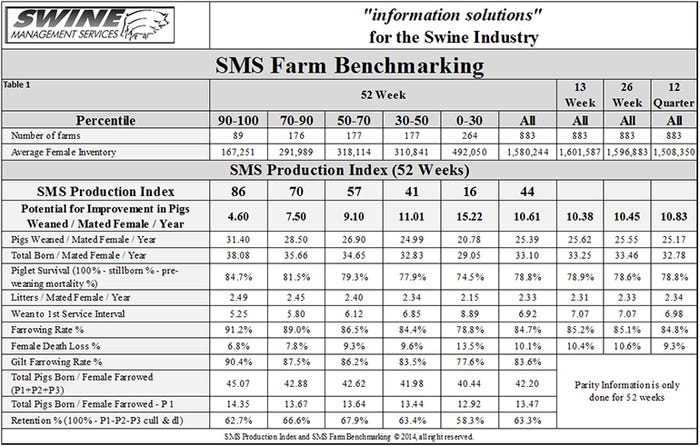
Table 1 provides the 52-week rolling averages for 11 production numbers represented in the Swine Management Services Production Index. The numbers are separated by 90-100%, the 70-90%, the 50-70%, the 30-50% and the 0-30% groups. We also included the 13-week, 26-week and 12-quarter averages. These numbers represent what we feel are the key production numbers to look at to evaluate the farm’s performance.
At SMS, our mission statement is to provide “information solutions for the swine industry.” We feel with the creation of the SMS Benchmarking databases for all production areas we now have more detailed information to share with the swine industry. If your farm would like to be part of the SMS Benchmarking databases or if you have suggestions on production areas to write columns about, email us at [email protected], [email protected] or [email protected].
We enjoy being a part of the NHF Daily team. Previous Production Preview columns can be found at www.NationalHogFarmer.com.
You May Also Like
