How Housing Affects Sow Performance
Producer conducts side-by-side comparisons of sow housing options.
March 15, 2012

Within their 30,000-sow production system, the Sleepy Eye, MN-based firm focused on a pair of 5,000-sow gestation barns — one with sows in groups and equipped with an electronic sow feeding (ESF) system, the other equipped with standard, individual sow gestation stalls.
Speaking at the Leman Swine Conference in St. Paul, MN, last fall, Mark Schwartz laid out the ground rules for their comparison.
All sows were weaned into stalls to allow individual feeding according to their post-lactation body condition and to ensure effective heat detection and insemination. Sows destined for pens equipped with ESF were grouped 135/pen (65-70 sows/ESF feeder) after pregnancy was confirmed and embryo implantation had taken place. Sows destined for stalls were likewise confirmed pregnant before being placed in individual stalls.
Feed intake data was available for a 39-month period from January 2008 to March 2011. However, data on reproductive performance, sow removal (by parity and by reason) and labor requirements were pared down to four quarters (Quarter 2, 2010 through Quarter 1, 2011), due to changes in porcine reproductive and respiratory syndrome (PRRS) status of the farms before and after this period, Schwartz explained.
Replacement breeding stock for both farms came from the same multiplier, although differences in feed formulation and source, semen source, gilt vaccination protocols and gilts’ age at first service existed. In addition, average lactation length differed — 20.3 days for group-housed sows vs. 21.1 days for sows gestated in stalls.
Reproductive Performance
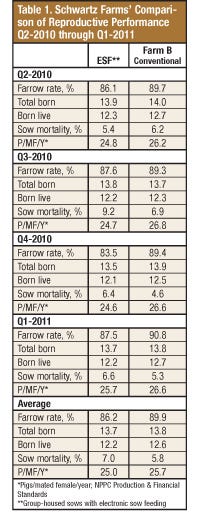
The reproductive performance parameters measured included farrowing rate, total born/litter, live born/litter, sow mortality and pigs weaned/mated female/year (PW/MF/Y). Table 1 shows small differences in all parameters, by quarter and as a composite, although the difference in sow mortality is noteworthy.

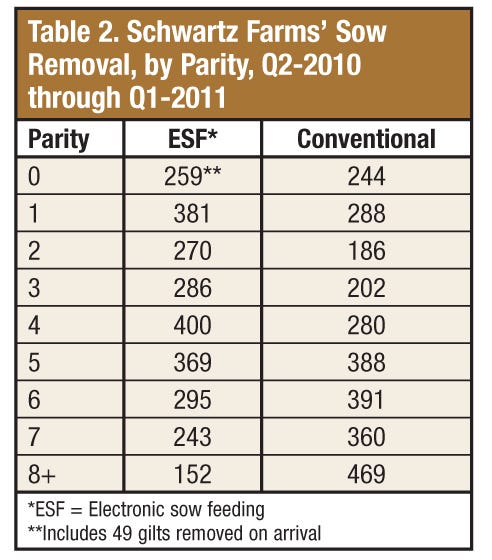
Sow removal by parity (Table 2) shows the group-housed sows with ESF removed more Parity 1, 2, 3 and 4 sows than did the farm with gestation stalls.

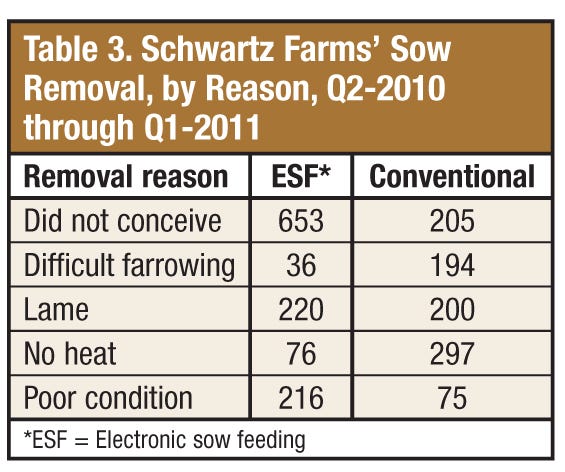
The reasons for culling sows are listed in Table 3. “It is interesting to note several major differences between the farms,” Schwartz noted. The ESF-equipped farm removed 653 sows for failure to conceive compared to 205 sows in stalls. However, failure to express estrus was more prevalent when breeding females were housed exclusively in stalls — 297 labeled “no heat” vs. 76 “no heat” when housed in groups.

In addition, “difficult farrowing” was listed as the reason for culling 194 stall-housed sows, while 36 group-housed sows were culled for that reason. Culls for lameness were similar — 220 in group housing vs. 200 in stalls.
Gestation feed intake was tracked for the full 39-month dataset (January 2008 to March 2011). ESF-housed sows averaged 4.92 lb./day, while sows in stalls averaged 5.14 lb./day.
Conversely, group-housed sows ate less in lactation (14.7 lb./day) vs. sows housed in stalls (15.9 lb./day). Average cull weights and parity reflected the additional feed intake in lactation as group-housed sows averaged 473 lb. at culling, while their counterparts averaged 498 lb.
Schwartz reported that 8.29 hours of labor were required to manage sows in groups vs. 7.82 hours/sow with stalls. The labor estimate included hours spent for production, sanitation, maintenance and on-site management. Farms differed in the design.
On average, group-housed sows with ESF require about 2 sq. ft. more than sows housed in conventional gestation stalls — 22 sq. ft./sow vs. 20 sq. ft./sow, Schwartz calculated.
“A building constructed to house 2,000 sows in large pen gestation in a 5,000-sow unit requires approximately 4,000 additional square feet,” Schwartz explained, citing the additional pit floor, slats, pillars and beams, pit side walls, building side walls, ceiling roof truss and attic insulation required.
“Standard depreciation and interest charges equate to approximately 10 to 15 cents/weaned pig in additional cost of production because of the additional space requirements of the ESF system,” he added.
Schwartz Farms’ attempt to analyze large pen gestation housing relative to conventional housing was confounded by changes in health status (i.e. PRRS) of the farms over time. “Data will continue to be gathered across the system; with PRRS control techniques, including additional filtration, we anticipate the access to more information will be accelerated,” he noted.
Schwartz believes 2-3 years of data is necessary to effectively analyze differences in the two systems.
He challenges those who assume this model is easily translated to day-to-day production practices to be mindful of the macro-implications. “For example, due to its proximity to resources, the ESF model benefitted from intense managerial engagement, which may be difficult to duplicate,” he says.
“Of greater significance, however, is the recognition that this model is based on new or expanded construction. The pork industry is matured and, as such, so too are the majority of buildings,” Schwartz continued. “Adopting this technology in a retrofitted situation would be considerably more expensive and complicated because existing floor plans and building sizes would substantially restrict layout options. Retrofitting an existing building would likely result in a 15% decrease in the sow population, thereby increasing the cost of production and, ultimately, the price of pork for consumers.”
You May Also Like


