Where have you been? Where are you going?
Swine Management Services’ database shows progress in the industry the last three years. How has your farm done in the same time period?
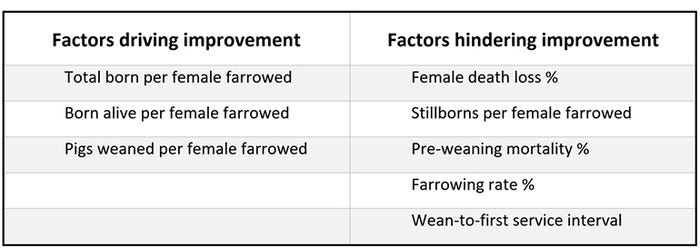
From an industry perspective there certainly has been major progress in some areas over the last three years while other areas have actually seen a decline. For all of the charts in this column we are looking at 898 farms with 1,551,900 mated females from all around the world but mostly the United States and Canada. Most of these farms are independent farms or systems. The three years represented ended Nov. 18, and each bar on the graph represents a 13-week period. The factors driving the improvement over the last three years and those that have hindered it will be addressed in this column.
Pigs weaned per mated female per year (Chart 1) with the trend line (black line) showing improvements over the last three years — the average of 25.99 for the three years with the last six quarters over 26.00 pigs weaned per mated female per year. Total born per female farrowed (Chart 2) has made a lot of progress over the last three years with the database averaging 14.44 over the three-year period and the last three quarters at 14.70. Born alive per female farrowed (Chart 3) is also making progress but stillborns per female farrowed (Chart 4) is hindering the full potential of progress. Without the improvements to total born per female farrowed over the last three years the industry would not have made progress in pigs weaned per mated female per year.
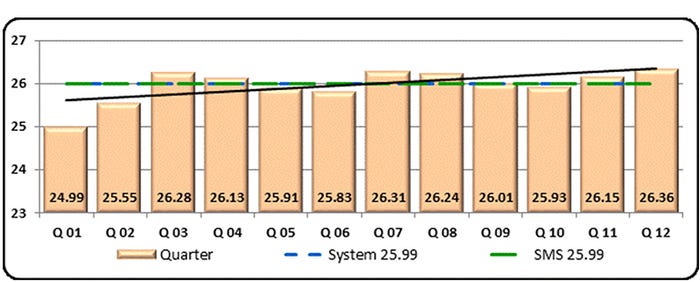
Chart 1: Pigs weaned per mated female per year
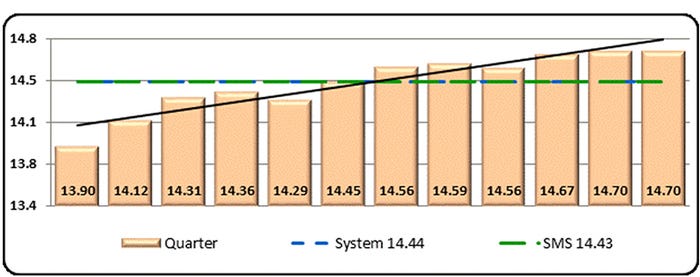
Chart 2: Total born per female farrowed
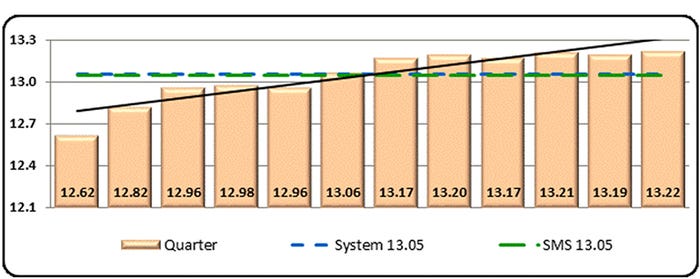
Chart 3: Born alive per female farrowed
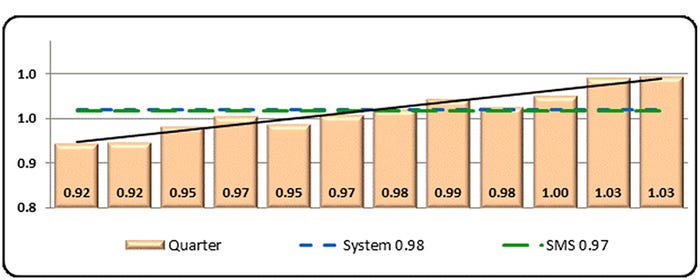
Chart 4: Stillborns per female farrowed
As total born has increased, pre-weaning mortality (Chart 5) has as well. With more total born it takes considerably more work to save those pigs. Have you changed your protocols for Day 1 pig care over the last three years? Are you managing colostrum to ensure all pigs get an adequate amount? An improvement of 1.0% in piglet survival (100% - percent stillborns - percent pre-weaning mortality) is equal to 0.29 pigs weaned per mated female per year.
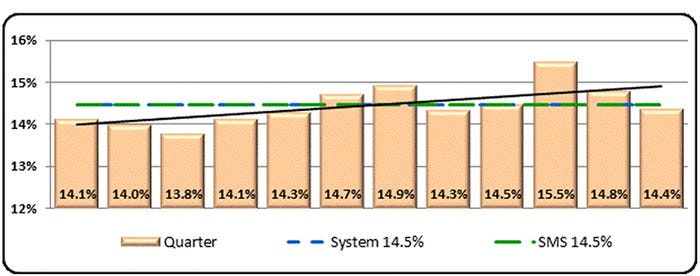
Chart 5: Pre-weaning mortality percent
A trend that is surprising is that farrowing rate (Chart 6) has not improved over the last three years and has a slight negative trend. There could be several things driving that, one being in Chart 7 looking at wean-to-first service interval having a negative trend line as well over the last three years going up just slightly. An improvement of 1.0% in farrowing rate is equal to 0.34 pigs weaned per mated female per year. Are you tracking artificial insemination technicians, evaluating their performance on farrowing rate and total born? Are you tracking semen batch numbers and evaluating farrowing rate and total born to see its performance? Are sows losing too much body condition in farrowing? Are you using conventional AI and breeding only one female at a time?
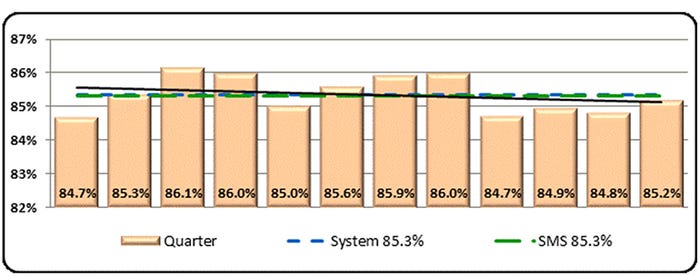
Chart 6: Farrowing rate percent
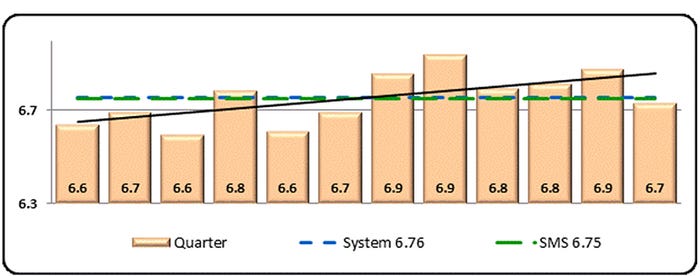
Chart 7: Wean-to-first service interval days
The final factor is female death loss percent (Chart 8). A negative trend that we have talked about previously with the database at over 10% for the last 52 weeks. An improvement of 1.0% in sow death loss is equal to 0.25 pigs weaned per mated female per year. While pelvic organ prolapses have increased over the last few years, the biggest cause of deaths is still revolves around lameness and injuries. There may be little that we can do today to reduce prolapses but there is a lot that can be done to reduce lameness and injuries. Early detection of issues is second only to making sure that the correct animals are entering the herd.
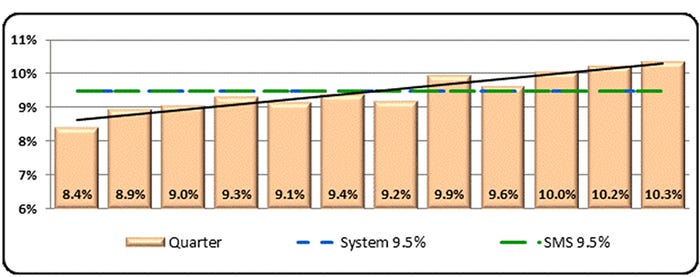
Chart 8: Female death loss percent
A 1.0% change in those three areas would mean a change of 0.88 pigs weaned per mated female per year. Small 1.0% changes can really add up in big ways within an operation.
In this column, we have looked at where the industry has been over the last three years. Where has your farm been? What are the negative factors or the opportunities for improvement in your farm? Winston Churchill said, “A pessimist sees the difficulty in every opportunity; an optimist sees the opportunity in every difficulty.” There is no doubt you want to turn around some of those negative factors. What are the opportunities in your operation?
Eliyahu M. Goldratt wrote three questions that all owners and managers need to ask in the book The Goal, “What to change?”, “What to change to?” and “How to cause the change?” As we come to the end of the year what are the goals for your farm? What do you have to change to achieve them? Does the team have the knowledge and the resources to make the changes to achieve the goal?
“You can do anything as long as you have the passion, the drive, the focus and the support,” Sabrina Bryan, a movie star and singer, has said. Labor is a major issue today, so it is more important than ever to provide the support and the focus that a team needs to be successful.
Support comes in many forms and can be free or it can be quite expensive, however what does it cost the operation to lose good employees, be understaffed, train new employees and for the team’s morale? Ask your team what they want for the future of the farm. What do they need to accomplish those goals? Then make them visible within the farm for them to see, keep a score card of the progress being made and most importantly reward the team for achieving the goals. Provide the support your team needs, and if you don’t know what it is, ask the questions to find out. What can your team accomplish in 2019?
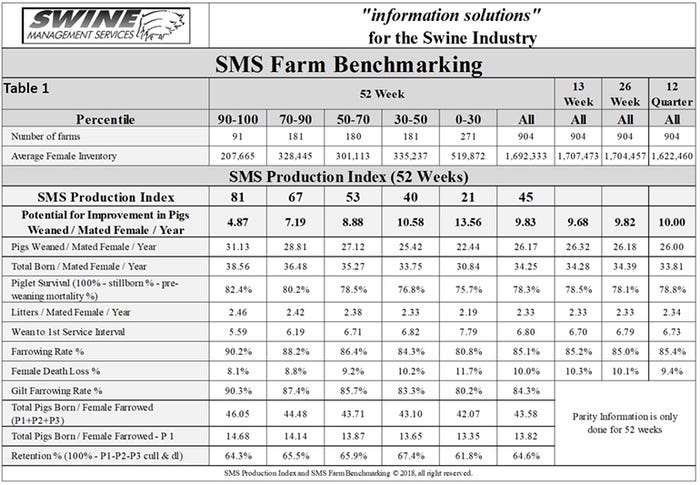
Table 1 provides the 52-week rolling averages for 11 production numbers represented in the Swine Management Services Production Index. The numbers are separated by the 90-100%, the 70-90%, the 50-70%, the 30-50% and the 0-30% groups. We also included the 13-week, 26-week and 12-quarter averages. These numbers represent what we feel are the key production numbers to look at to evaluate the farm’s performance.
At SMS, our mission statement is to provide “Information solutions for the swine industry”. We feel with the creation of different SMS Benchmarking databases for all production areas we now have more detailed information to share with the swine industry. Contact us if your farm would like to be part of the SMS Benchmarking databases. We enjoy being a part of the National Hog Farmer team. Previous columns can be found at NationalHogFarmer.com.
If you have questions or comments about these columns, or if you have a specific performance measurement that you would like us to write about, contact Mark Rix, Ron Ketchem or Valerie Duttlinger.
About the Author(s)
You May Also Like

