What is your farms wean-to-service interval?
Is the first wean-to-service interval a good predictor of lifetime wean-to-service interval or herd longevity?
For this column we are taking a little different approach when looking at wean-to-service interval. We pulled 22 farms from the database and pulled all individual sow records for those farms over the last three years. These 22 farms were selected for a couple of reasons, first being that they did not experience a porcine reproductive and respiratory syndrome or a porcine epidemic diarrhea virus challenge in the last three years. A second reason was because of the record program they were using allowing for ease of comparison.
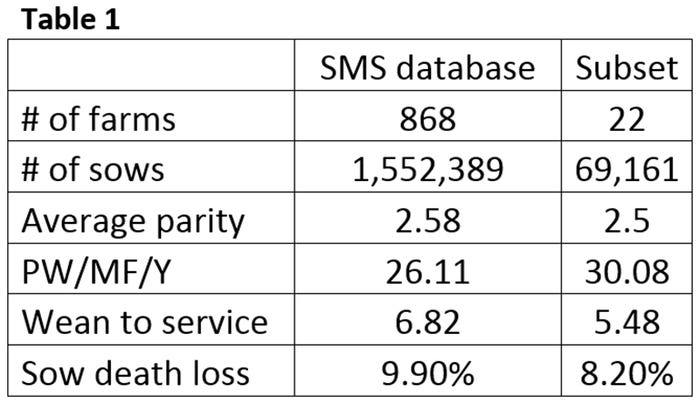
Table 1 shows some of the key performance indicator averages for the entire Swine Management Services database as well as the subset of 22 farms. There is a range of performance from farms over 34 pigs weaned per mated female for the last 52 weeks down to 23 pigs weaned per mated female in the subset. Wean-to-service interval ranged from 4.47 days to nine days. The farms in this subset averaged 5.48 days compared to the SMS database at 6.82, a difference of 1.34 days. Taking into consideration the cost of feed and housing at $2.50 per day for the 1.34 days difference it is an $11.8 million impact on just the SMS database of 1.5 million sows. Is the first wean-to-service interval a good predictor of lifetime wean-to-service interval or herd longevity?
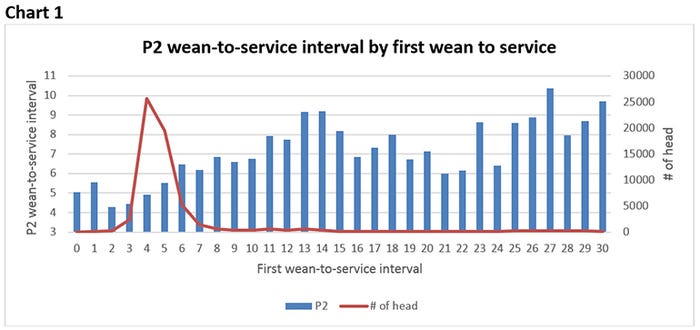
The following data take into account over 591,000 farrowing records. In Chart 1 it shows that the higher their first wean-to-service interval (X axis) was, the higher the Parity 2 intervals (Y axis) were as well. For example, if her first wean-to-service interval was six days she averaged 6.3 days for her P2 wean-to-service interval. In Chart 2 it shows the wean-to-service interval (X axis) same for Parity 3 as well, up to Day 14 for the first wean-to-service interval (Y axis). If the first wean-to-service interval as over 14 days, the P3 average was lower than those in the 11-14 day first service. In Chart 3 it looks at lifetime average wean-to-service interval (Y axis), if the first wean-to-service interval (X axis) was more than eight days the sows averaged over six days for the lifetime.
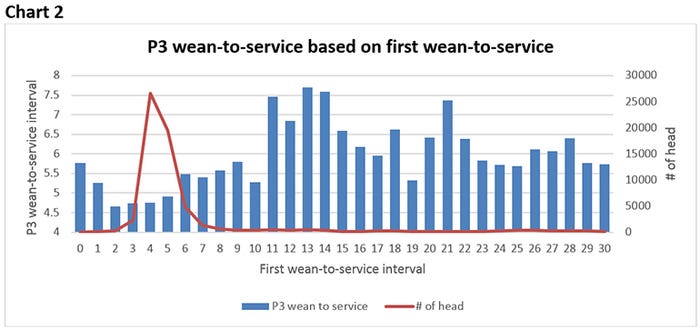
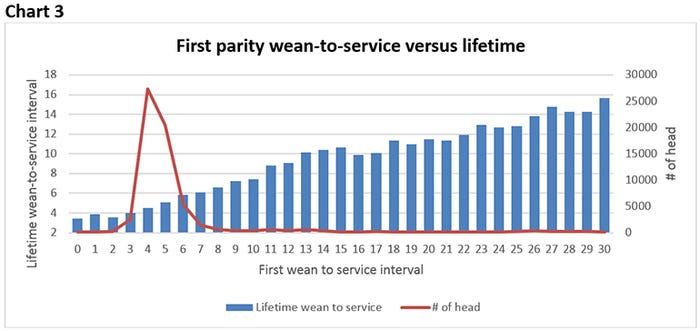
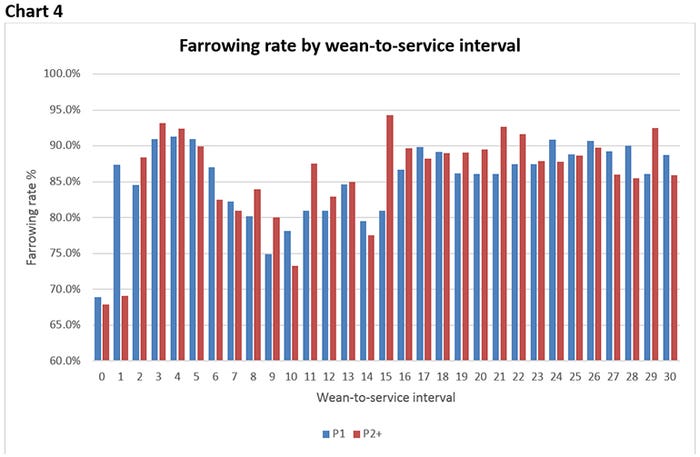
Chart 4 looks at farrowings (Y axis) for P1 wean-to-service interval (X axis) and resulting farrowing rate compared to all other parities. With a few exceptions, there really isn’t much of a difference in the resulting farrowing rate between the two parity groups. Should a first parity stay in the herd longer with a higher wean-to-service interval just because she is young?
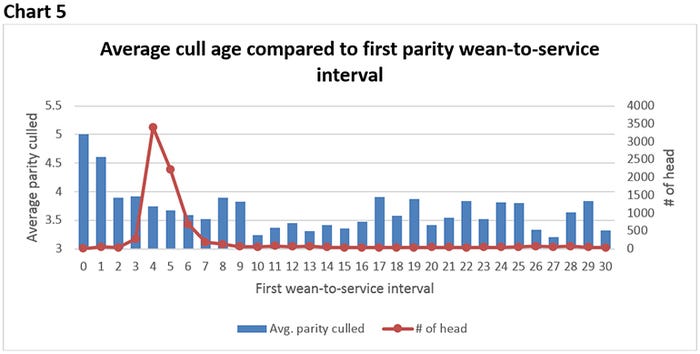
In Chart 5 we limited the records to just those sows that had been removed from the herd. We looked at their first wean-to-service interval (X axis) and how it impacted the average parity culled (Y axis). Again, there is a lot of variation in the average removal parity which just shows that there are a lot more things that impact removal parity than just the wean-to-service interval of the first parity. Those with first wean-to-service interval of Day 8 or 9 actually stayed in the herd longer than those who had a first wean-to-service interval Day 4-7.
So, what are the management practices that we see drive wean-to-service interval the most?
• Amount of lactation consumption
• Boar exposure and lots of it starting the day they are weaned
• Feeding 8 plus pounds per day after weaning until bred
• Having well-trained technicians and enough to make sure that sows aren’t being missed in the line as they lock up prior to the boar arriving to them.
What is your farms wean-to-service interval?
Extended deadline for sow housing study
SMS and the University of Nebraska are working together on an extensive sow housing study. This study is open to all farms in the United States and Canada that have been operating for at least three years and using the same housing system for one year. There is an extensive survey to fill out as well as submitting your production data file. If you are interested in participating in this project, contact Benny Mote at 402-310-9878 or Valerie Duttlinger with Swine Management Services at 812-430-5969. All data must be submitted by Sept. 1 to participate in this study.
SMS Production Index
Table 2 provides the 52-week rolling averages for 11 production numbers represented in the SMS Production Index. The numbers are separated by 90-100%, the 70-90%, the 50-70%, the 30-50% and the 0-30% groups. We also included the 13-week, 26-week and 12-quarter averages. These numbers represent what we feel are the key production numbers to look at to evaluate the farm’s performance.
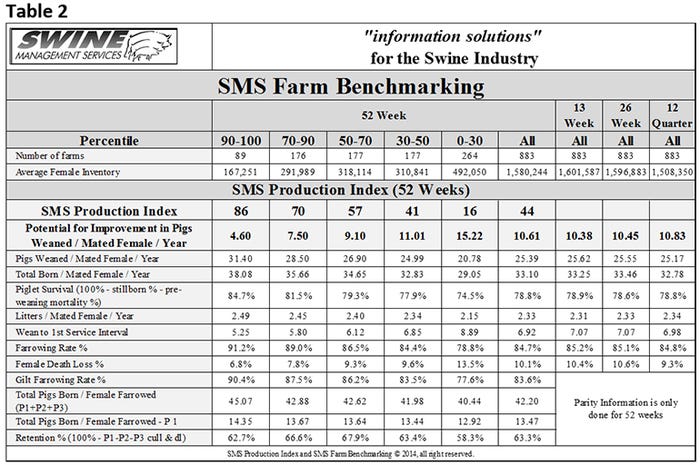
At SMS, our mission statement is to provide “Information solutions for the swine industry.” We feel with the creation of different SMS Benchmarking databases for all production areas we now have more detailed information to share with the swine industry. If your farm would like to be part of the SMS Benchmarking databases, or if you have suggestions on production areas to write columns about, please contact Mark Rix, Ron Ketchem or Valerie Duttlinger. We enjoy being a part of the NHF Daily team.
About the Author(s)
You May Also Like
