What does 784,000 services on high producing farms say?
July 3, 2016
We decided to take a look at the changes over the last few years in wean to first service interval for the high performing farms in the Swine Management Services database that has grown to 989 farms with female inventory of 1.705 million females.
We have been tracking the trend lines for 10 years for several key production numbers. In Chart 1, wean to first service interval has been somewhat flat for all farms (red line) since 2006 when we started collecting this number. However, starting in late-2011 the line started to drop. We feel this was about the time more farms went to more aggressively feeding sows in lactation by increasing the number of feedings per day, running the drop feed systems more time or added new feeders or retrofitted feeders with ad-lib feeders with storage hoppers.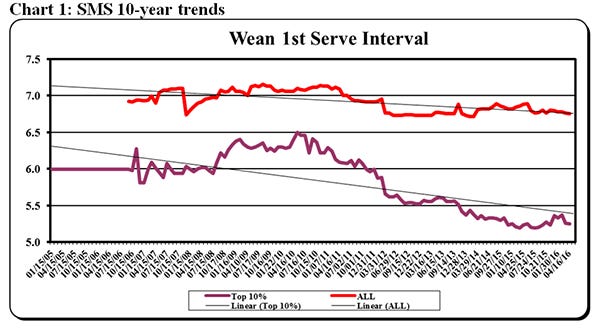
The drop in days to cycle was more pronounced in the top 10% farms (purple line) with farms starting in 2006 at six days going up to seven days in 2010, and then dropping to about 5.3 days the last year. That is a difference of 1.5 days to cycle between the top 10% and the all average.
The data shows in Chart 2 that farrowing rate was pulled from 608 farms with 1.59 million females that had production at more than 20 pigs weaned per mated female per year and were not new startups, depopulations or repopulating or dealing with a health challenge. The chart is set up with wean to first service interval on the X-axis and farrowing rate on Y-axis.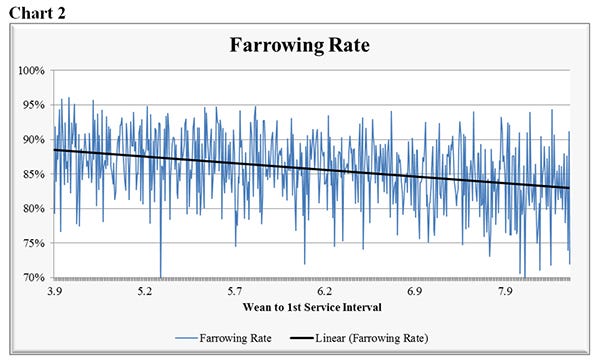
There, like usual, is a lot variation, however the trend line shows as days to cycle increase there is a drop in the farrowing rate.
To look even deeper at the effect of wean to first service interval on production of the high-producing farms data was selected from 28 sow farms that are in the SMS consulting data base. These 28 farms’ average for the last three years was 28-plus pigs weaned per mated female per year with five at 32-plus pigs. That represented a total of 784,000 services.
Table 1, wean to first service interval by parity, is set up by parity with wean to first service interval on the X-axis broke out by farms at 28-<30 pigs, 30-<32 pigs and >=32 pigs weaned per mated female per year. As the data shows average days for the >=32 pigs at 4.52 days with all parities average under five days. Also the table shows wean to first service interval across all parities are low with P1 average at only 5.13 days. These 28 farms also have very high farrowing rate as shown in Table 2, Farrowing Rate by Parity, with average at 90.3% with the farm at >=32 pigs at 91.8%. The question is what are these sow farms doing to get weaned sows to cycle sooner and then seeing a high farrowing rate?
So going back to looking at how services break out by parity you need to look at Table 3, Percent of Services. This chart is broken out by wean to first service interval is very interesting. Days are broken out by 1, 2, 3, 4, 5, 6, 7, 8, 9 and 10-plus days. The table shows that 4.5% of weaned sows are bred day 1-3. That number has gone up as more farms are using more nurse sows, doing some split weaning and have some sows that have longer lactation days. This is why we suggest that farms start boar exposure the day sows are weaned and if a sow is found in heat she should be bred. The day 4 sows are now at 51% of the sows cycling, and day 5 at 33.2%. That puts 88.7% of the weaned sows bred by day 5. That puts only 4.7% of sows breeding on day 6, 1.2% day 7, and only 0.5% day 8. Over the last few years we have seen a shift to more sow farms with average days for sows to be bred at or below five days.
Now what is the performance of these early cycling sows bred day 1-3? Table 4, farrowing rate by wean to first service interval, shows those sows bred day 1 at 81.3% farrowing rate, day 2 at 87.9% and day 3 at 92.9%. The females that show the lower farrowing rates percentage are day 7 at 84.5%, day 8 at 80.2%, day 9 at 80.6% and those bred day 10+ at 87.6%.
What does this early cycling do to total born? Table 5, Total Born per Female Farrowed by Wean to First Service Interval, again shows those sows bred early are also very fertile with total born for day 1 at 15.26, day 2 at 15.43 and day 3 up to 15.91 pigs. Again those sows bred day 6+ did show a drop in total born with day 6 at 14.61 pigs down to 13.99 pigs for day 9. There was a jump in total born for weaned sows bred day 10+ to an average of 15.40 pigs. But remember most of these sows probably had at least one skip heat before breeding.
In the past when suggestions were to not breed the early cycling weaned sows and not start any heat detection until day 4 may have been wrong with today’s genetics. There needs to be changes on how these more productive females are managed in farrowing and from weaning to breeding. In your farm are you still waiting until day 4 to start breeding weaned sows? What day does your staff start boar exposure? Have you made the investment in people or equipment in farrowing to allow for full feeding of sows during lactation and from weaning to breeding? In looking at the top farms in the SMS data base with performance at 28-plus pigs you need to do some evaluation of your farm procedures at your farm.
SMS Production Index
Table 6 provides the 52-week rolling averages for 11 production numbers represented in the SMS Production Index. The numbers are separated by 90-100%, the 70-90%, the 50-70%, the 30-50% and the 0-30% groups. We also included the 13-week, 26-week and 12-quarter averages. These numbers represent what we feel are the key production numbers to look at to evaluate the farm’s performance.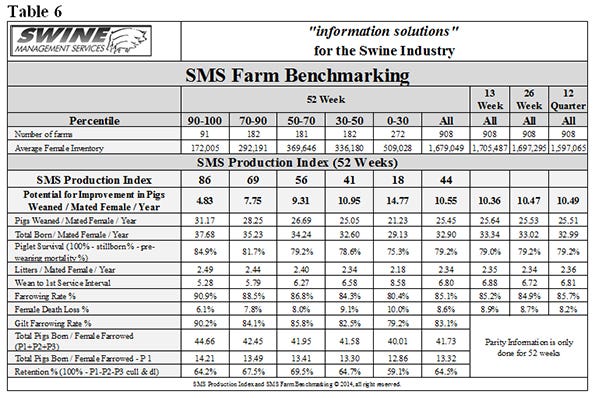 At SMS, our mission statement is to provide “Information solutions for the swine industry”. We feel with the creation of different SMS Benchmarking databases for all production areas we now have more detailed information to share with the swine industry. If your farm would like to be part of the SMS Benchmarking databases, or if you have suggestions on production areas to write articles about, please email [email protected] or [email protected]. We enjoy being a part of the National Hog Farmer Weekly Preview team. Previous Production Preview columns can be found at www.nationalhogfarmer.com.
You May Also Like


