Sow farm averages mean nothing
Averages work well as a benchmark to compare your farm to other farms, but when analyzing an individual farm, you need to look at the individual females and people.
December 5, 2016
Every year we sit down and set business and personnel goals (targets) for the new year. As you sit down to do that over the next month we wanted to give you something additional to consider.
Do averages mean anything when analyzing a sow farm? Averages work well as a benchmark to compare your farm to other farms, but when analyzing an individual farm, you need to look at the individual females and people. We are also going to look at the standard deviation. Normally we do not look that closely at standard deviation when analyzing farms because of the very large variation in sow farm production.
The standard deviation measures the amount of variation in a set of data values. A low standard deviation indicates that the data points tend to be close to the average, while a high standard deviation indicates that the data points are spread out over a wider range.
We picked 10 farms from the Swine Management Services Consulting Database that we also enter the data for in our office. This allows us to make sure all the data was collected and entered the same way. The 10 farms have 15,438 mated females. The farms range in size from 586 to 2,725 mated females. The farms range in age from 10 to 25-plus years. We are looking at the last three years of data on the 10 farms. There are 107,776 farrowings in last three years of data. We looked at the data for all three years in all numbers except for the pigs weaned per mated female per year and total born per mated female per year which are 12 month numbers.
The 10 farms average 27.02 pigs weaned per mated female per year (Table 1), comparing this to the average of whole SMS benchmarking database at 25.41 this puts them solidly in the top 50%. The 10 farms range from 31.00 to 24.48 pigs weaned per mated female per year. But as we have learned at SMS, averages don’t mean very much, you have to look at the individual farms. This puts two farms in the Top 10%, two farms in the 10-30%, five farms in 30-50% and one farm in the 50-70% range.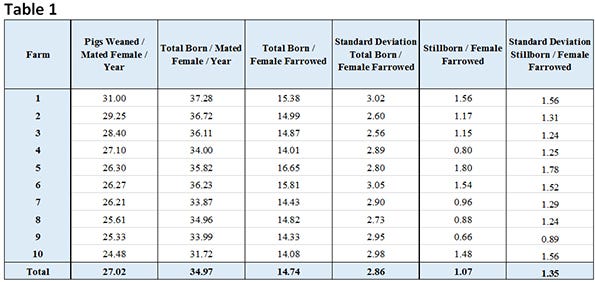
The 10 farms average 34.97 total born per mated female per year (Table 1), comparing this to the average of whole SMS benchmarking database at 33.10 this puts them solidly in the top 50%. The 10 farms range from 37.28 to 31.72 total born per mated female per year. This puts three farms in the Top 10%, three farms in the 10-30%, three farms in 30-50% and one farm in the 50-70% range.
The 10 farms average 14.74 total born per female farrowed (Table 1). Comparing this to the average of whole SMS benchmarking database at 14.20, this puts them solidly in the top 30%. The 10 farms range from 16.65 to 14.01 total born per female farrowed. This puts five farms in the Top 10%, three farms in the 10-30%, and two farms in 30-50% range.
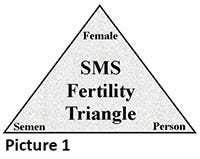
As we said earlier averages don’t mean a thing, we need to dig in deeper and look at the individual females farrowed. We use the SMS Fertility Triangle (Picture 1) when we look at total born per female farrowed. Total born per female farrowed relies on three parts – the female (condition), the semen (quality) and the person (artificial insemination technician). We have seen significant variation in total born when we look at semen batches and AI technicians involved in the breeding.
In Table 2, Percent of Females Farrowed by Total Born per Female Farrowed, you will see total born broke out by farm and total born by female. The table shows only 1.5 % of females farrowed had a total born <= five pigs with a total of 11.2% at 10.0 pigs or less, on the high side 6.4% of the females farrowed had >= 20 pigs. There were 39.9% of the females farrowed at >= 16 pigs with the remaining 49.0% in the range of > 10 to < 6 pigs. The variation between the farms is very high with 18.2% of farrowings on one farm having >=20, and five of the farms have less than 5% of the farrowings with >=20 pigs. Standard deviation is very high in total born per female farrowed.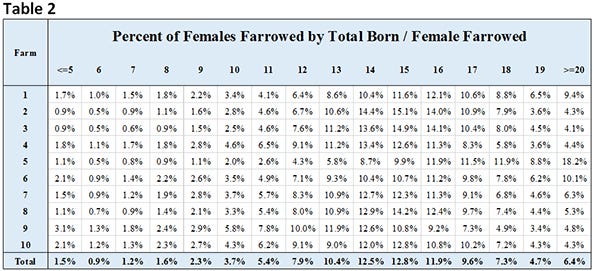
The 10 farms average 1.07 stillborn per female farrowed (Table 1); comparing this to the average of whole SMS benchmarking database at 0.99 this puts them in the 50-70%. The 10 farms range from 0.66 to 1.80 stillborn per female farrowed. This puts one farm in the Top 10%, two farms in the 10-30%, one farms in 30-50%, and six farms in the bottom 30% range.
We looked into more detail about stillborns in Table 3, Percent of Females Farrowed by Stillborns per Female Farrowed, and Table 4, Percent of Total Stillborns by Female Farrowed. To set Table 3 up the farms are in the Y-axis and the X-axis is percent females that had zero, one, two, three, four or five and more stillborns per female farrowed. The table shows 49.5% of the females farrowed had zero stillborn, 25.6% had one stillborn, 13.1% had two stillborns, 2.9% had four stillborns and only 3.0% had five or more stillborns. But if you look at the individual farms, you will see a lot of variation. Looking at >=five stillborn by farm, the range was 0.7 to 7.9% of the females farrowed. At zero stillborns, the 10-farm range was 39.7 to 70.2%.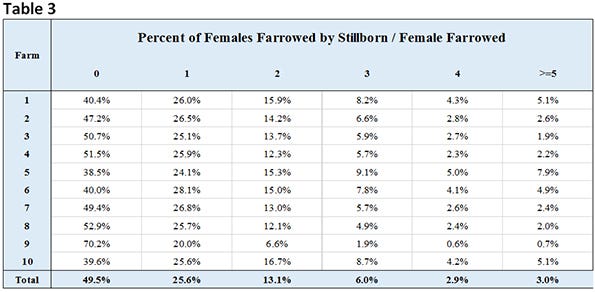
In Table 4, the set up is the same with individual farms on the Y-axis and X-axis being of total stillborns by female farrowed. Of all the stillborns recorded 25.5% came from females with only one stillborns, 26.1% of all stillborns were from females with two stillborns, 18.1% from females with three stillborns, 11.4% from females with four stillborns and 18.9% of all the stillborns from females having five or more stillborns. Three percent of sows having five or more stillborns accounted for 18.9% of all stillborns. If you look at sows with three-plus stillborns, which is 11.9% of all the females farrowed, they account for 48.4% of the total stillborns recorded. If you look at the individual farms you will see a lot of variation with Farm 9 showing 70.2% of the sows had zero stillborns but 42.9% of all stillborns were from females with only one stillborn.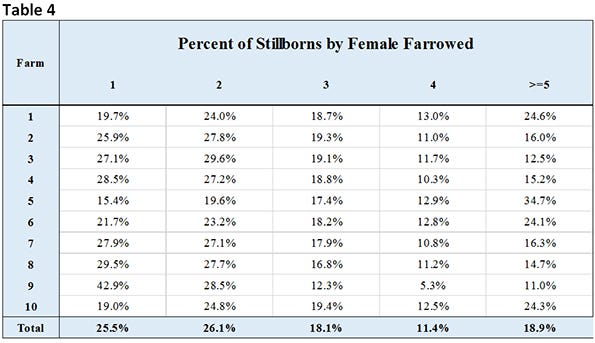
We feel that each farm should break down their data into more detail and seeing where the problems are and then put together a plan to improve that area. What do you do with your records? Do you look at just the averages or the individuals?
SMS Production Index
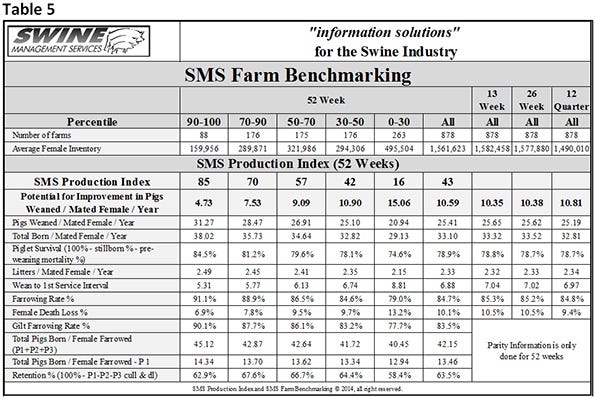
Table 5 provides the 52-week rolling averages for 11 production numbers represented in the SMS Production Index. The numbers are separated by 90-100%, the 70-90%, the 50-70%, the 30-50% and the 0-30% groups. We also included the 13-week, 26-week and 12-quarter averages. These numbers represent what we feel are the key production numbers to look at to evaluate the farm’s performance.
At SMS, our mission statement is to provide “Information solutions for the swine industry.” We feel with the creation of different SMS Benchmarking databases for all production areas we now have more detailed information to share with the swine industry. If you have questions or comments about these columns, or if you have a specific performance measurement that you would like us to write about, please contact [email protected], [email protected] or [email protected]. We enjoy being a part of the National Hog Farmer Weekly Preview team. Previous Production Preview columns can be found at NationalHogFarmer.com.
You May Also Like
