Saving stillborns improves profits
July 6, 2015

Prices for weaned pigs have been dropping the last few weeks and they look to be lower for an extended period of time. It is time to become more efficient in farrowing by saving more pigs per sow. We estimate that for each additional pig that is saved per sow per year the breakeven for all pigs drops an estimated $1.20.
For this column we decided to look deeper into stillborns. We have done some work with producers asking them to weigh stillborn pigs with results showing a range of 2.71 to 3.13 pounds per pig. These are not the small weak pigs that are being born.
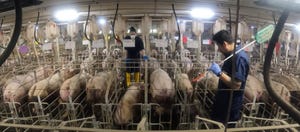
For several years now we have talked about how improving Day 1 pig care can lower stillborns and pre-weaning death loss. Day 1 pig care has different meanings to different farms. The farms that have shifted more labor to farrowing extended the time someone is attending sows farrowing or started drying pigs as soon as possible after farrowing have improved piglet survival by lowered stillborns and pre-weaning death loss.
In Table 9, Swine Management Services Farm Benchmarking which represents 890 farms with female inventory of 1.6 million females shows the last 52 weeks average for pre-weaning death loss at 14.0%, the top 10% lower at 9.9% and the bottom 30% up to 17.0%. Stillborns average per litter for all farms at 6.6% which is 0.92 pigs per litter with the top 10% at 5.0% which is 0.74 pigs per litter and the bottom 30% at 7.1%, which is 0.94 pigs per litter. As you can see there are more stillborns pigs to be saved.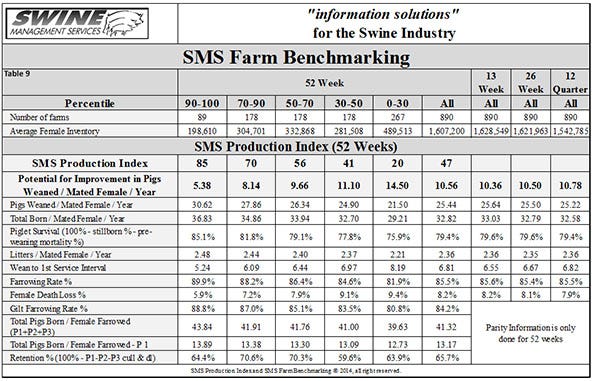
For the column this month we selected farms that we do consulting and data analysis for on a regular basis. We have good knowledge of what is going on at these farms and we are constantly trying to get them to try new ideas that can help to improve pigs weaned per mated female per year. Some have been more progressive by trying some of these ideas by making changes to Day 1 management on the farms. We selected 37 farms which have 70,000-plus sows which we called “normal labor” and six farms which have 30,000-plus sows we called “20-plus hour Day 1 care.”
Day of the week matters
Table 1 and 2 have stillborns broke out by the day that the farm recorded stillborns and the start of farrowing. Table 1: normal labor has a total of 426,328 litters with average total born at 13.78 pigs and stillborns at 0.87 per litter (6.3%). Looking at Table 1, Friday stands out as the day of the week that the most females farrow. Are some of these farms doing selected inducing on Thursday to reduce the number of sows that farrow on the weekends? We also looked at the total born that shows total born higher for females farrowing Tuesday to Friday. We were surprised to see that stillborns were consistent by day of week farrowed.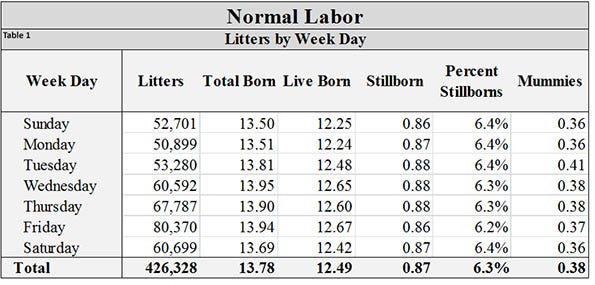
Table 2: 20-plus hour Day 1 care shows for 220,773 litters that total born for these farm was at 14.69 pigs which was 0.91 pigs higher than farms called “normal labor.” Table 2 shows fewer sows are farrowed Sunday, Monday and Tuesday for these farms. These farms did save more pigs with stillborn averaging 0.59 pigs versus “normal labor” at 0.87 pigs. That is a drop in percent stillborn of 2.3% which was 0.28 pigs per litter.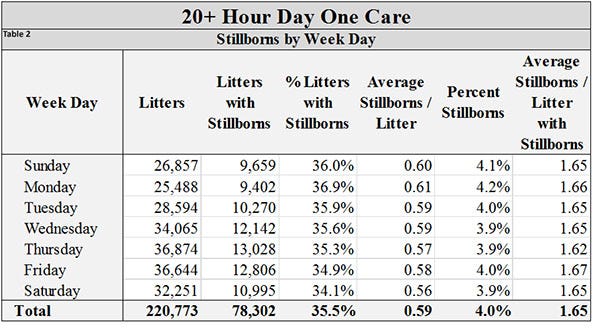
Stillborns by week day
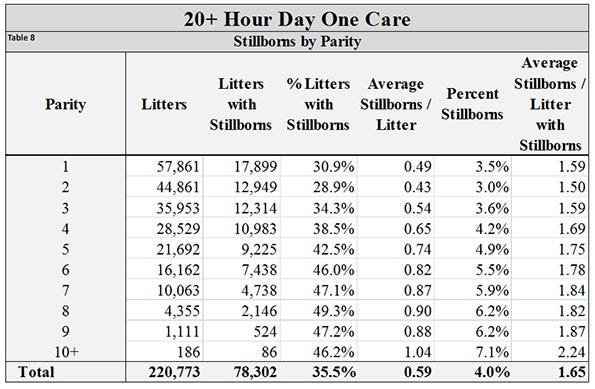
In Table 3 and 4 continuing to look at stillborns by day of week we wanted to know what percent of the females farrowing had stillborn pigs. Table 3: normal labor shows that on average 45.9% of the litters had at least one stillborn versus Table 4: 20-plus hour Day 1 care at 35.5%. That shows a drop of 10.4% in litters having stillborns when hours of attending females were increased. We also found it interesting to see average stillborns per litter with stillborns at 1.90 pigs for “normal labor” and dropping to 1.65 pigs for farms with 20-plus hour day one care.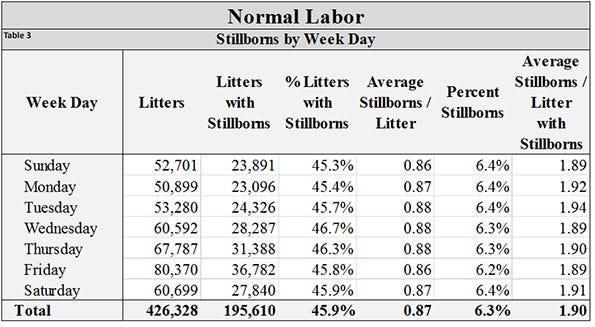
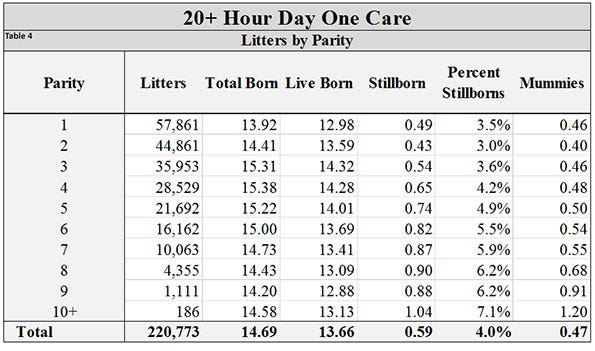
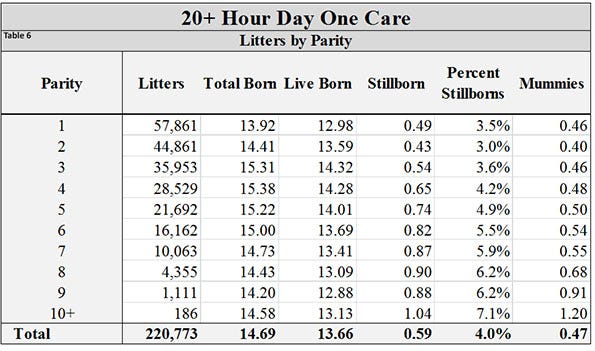
We all know that higher parity females have more stillborns. For this column we broke out parities from one to 10-plus litters. You will find this information in Tables 5, 6, 7 and 8. Again Tables 5 and 7 are normal labor which was 37 farms and Tables 6 and 8 which are 20-plus hour day one care was six sow farms. Table 5 normal labor shows total born starting at 13.14 pigs for P1 with stillborns at 0.73 pigs per litter increasing to 13.45 total born for P10-plus with stillborns up to 1.60 pigs which was 11.9%. Table 6, 20-plus hour Day 1 care with P1 total born up to 13.92 pigs with stillborns at 3.5% which is 0.49 pigs per litter up to only 186 P10-plus females with total born at 14.58 pigs with stillborns at 1.04 pigs per litter which was 7.1%.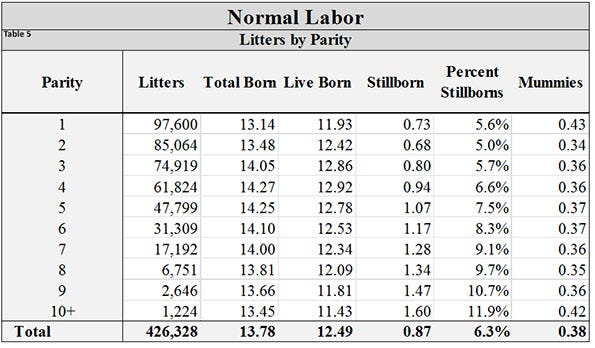
Stillborns by parity
In Tables 7 and 8 we added the two columns “percent litters with stillborns” and “average stillborns per litter with stillborns.” Just like we already knew, stillborns go up by parity with Table 7 showing 40.3% of the P1 females had at least one stillborn with average at 1.82 pigs. In Table 8, where the farms are in farrowing 20-plus hours per day that drops to only 30.9% of the P1 females have a stillborns with average at 1.59 pigs. Data do confirm that older females have more stillborns.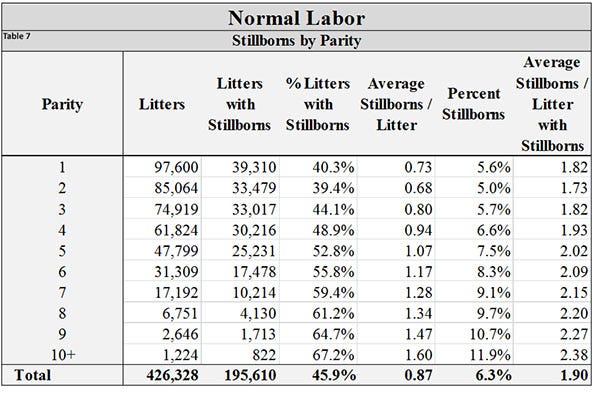
Where is your farm at on saving a few more pigs in farrowing? We feel it starts with increasing hours per day someone is in the farrowing rooms checking sows every 20 to 30 minutes, monitoring their progress with a log sheet, and sleeving more sows to pull out problem pigs. Do all farms need to extend farrowing hours to 20-plus? In the smaller farms we have found that a second shift in farrowing extended hours to 18 per day will cover about 85-plus all sows farrowing. We feel extending farrowing hours is not just for the larger sow farms. If your farm is running more than 1.0 stillborn pig per litter you need to consider adding more labor to farrowing or just have some of the crew come in later in the day and stay into the evening on the heavy farrowing days.
If you want to cut your costs to produce a weaned pig it starts by reducing the number of stillborns in farrowing. We do not know of any silver bullets to lower stillborns except to be there while the pigs are being born.
SMS Production Index
Table 9 provides the 52-week rolling averages for 11 production numbers represented in the SMS Production Index. The numbers are separated by 90 to 100%, the 70 to 90%, the 50 to 70%, the 30 to 50% and the zero to 30% groups. We also included the 13-week, 26-week and 12-quarter averages. These numbers represent what we feel are the key production numbers to look at to evaluate the farm’s performance.
At SMS, our mission statement is to provide “Information solutions for the swine industry.” We feel with the creation of different SMS Benchmarking databases for all production areas we now have more detailed information to share with the swine industry. If your farm would like to be part of the SMS Benchmarking databases, or if you have suggestions on production areas to write columns about, please email us at [email protected] or [email protected]. We enjoy being a part of the National Hog Farmer "Weekly Preview" team.
Previous Production Preview columns can be found at www.nationalhogfarmer.com.
You May Also Like


