Is There a Sweet Spot for Weaning Age?
What is the 'sweet spot' for weaning age? This analysis looks at the question in depth.
July 7, 2014
We received an e-mail this week asking “What is the sweet spot for weaning age?”
The farms we used in the data charts had to have more than 20 pigs weaned per mated female for the last 52 weeks and have parity structure with P7-plus sows. This way farms that are start-up or have had a health issue are pulled out.
That left 629 farms with 1,131,775 females for the data set. Pigs weaned per mated female per year had a range of 20.11 to 34.01 pigs; total born per mated female per year range of 25.17 to 41.10 pigs; litters per mated female per year range of 2.05 to 2.63 litters, and weaning age range of 14.83 to 28.42 days. In the data set the top 10% farms had average weaning age of 19.88 days, bottom 30% at 20.74 days with all farm average of 20.46 days.
Looking at Chart 1, Total Born per Mated Female per Year versus Weaning Age, the chart is set up on X-axis are the 629 farms sorted by weaning age with the youngest weaning age on the left side moving right as the age increases. The left Y-axis is total born per mated female per year and right Y-axis is weaning age.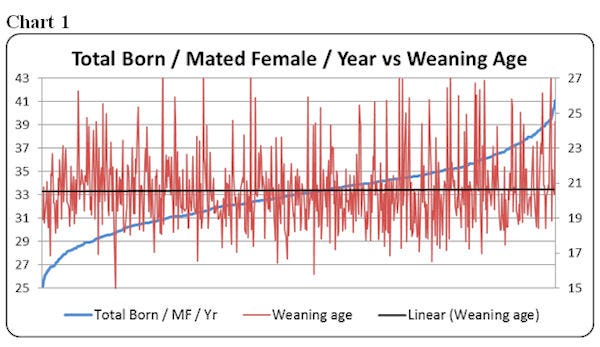
The blue line (Total born per MF per Year), red line (Weaning age) and black line is the linear trend line for weaning age. The chart shows there is a lot of variation in total born by farm no matter the weaning age. This tells us that there are a lot of factors that influence total pigs born. If you look at the linear line (black line) it is flat. That tells us that weaning age has little effect on total born per mated female per year.
Chart 2 shows Weaning Age versus Litters per Mated Female per Year with the X-axis being weaning age by farm with left Y-axis being weaning age by day and right Y-axis at litters per mated female per year. If you look at the linear line (black line) you see as the weaning age goes up litters per mated female per year trend down. So by increasing weaning age this increases the farrow-to-farrow interval, thus lowering the number of litters per mated female per year.
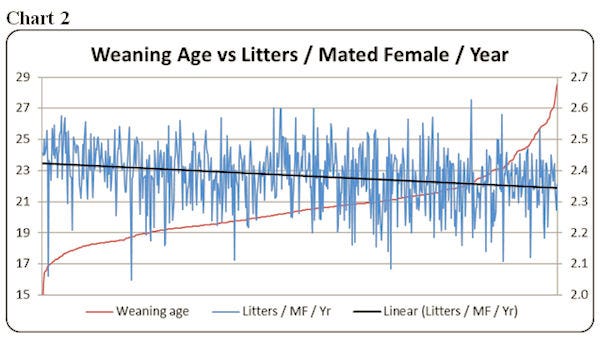
Chart 3 ‑ Weaning Age versus Total Born per Farrowing ‑ is set up with weaning age by farm on the X-axis, weaning age by day on the left Y-axis and total born per farrowing on the right Y-axis. Again looking at the chart you see lots of farm-to-farm variation in total born. The linear line is showing a little increase in total born as weaning age goes up. Also, we see some shift to more farms weaning at 21-plus days having more pigs.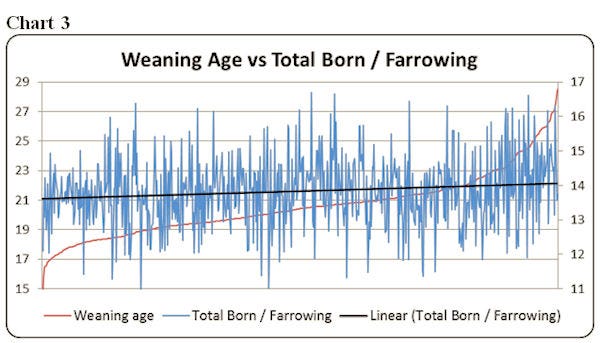
Charts 4, 5 and 6 are broken out by parity. Chart 4 ‑ P1 Weaning Age versus P2 Total Born per Farrowing to look at the effect weaning age has on the total born for the next litter. Now we are just looking at this information by parity of the farms. So you see in the chart there is a lot of variation in total born for P2 females by farm with a slight increase in total born as weaning age goes up. The chart does show farms with older weaning age have a higher total born number for the P2 females. The 629 farms had a range of total born per female farrowed of 10.73 to 16.80 pigs with average of 13.66 pigs with the top 10% at 14.29 pigs.
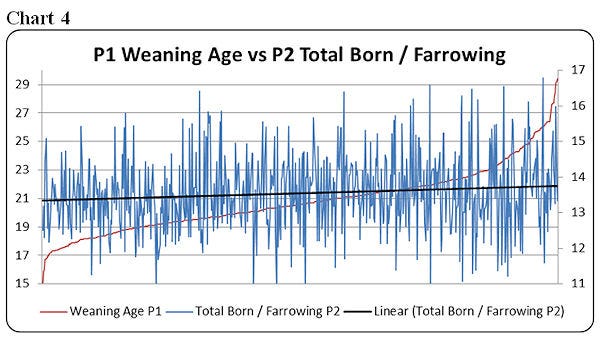
Chart 5 ‑ P2 Weaning Age versus P3 Total Born per Farrowing ‑ shows the same trend line of a small increase as weaning age goes up. Total born for P2 females at an average of 13.66 pigs with P3 females moving up to 14.35 pigs with the top 10% at 15.16 pigs with range of 10.70 to 17.62 pigs showing an increase of 0.69 pigs from P2 to P3.
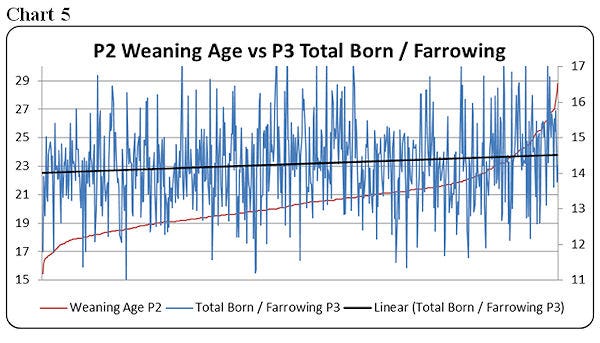
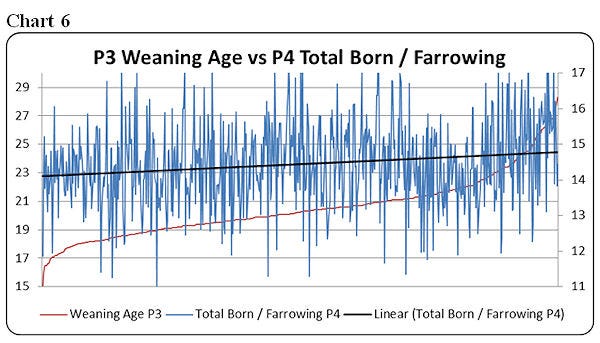
Chart 6 ‑ P3 Weaning Age versus P4 Total Born per Farrowing ‑ shows a slight improvement in total born as weaning age goes up. The average for P4 females for total born per farrowing was at 14.50 with a range of 10.67 to 18.02 pigs. The top 10% at 15.38 pigs shows like you would expect more total pigs born as parity increases.
Now, back to our original question ‑ what is the sweet spot for weaning age?
If you want to increase the total number of pigs born, just changing weaning age will have little influence. It tells us that there are many other factors that influence total born. As the data show the farms in the database have an average weaning age of 20.46 days.
At Swine Management Services (SMS), our mission statement is to provide “Information solutions for the swine industry.” We feel with the creation of the new Farm Benchmarking database we now have more detailed information to share with the swine industry. If your farm would like to be part of the Farm Benchmarking database, or if you have suggestions on production areas to look at, feel free to e-mail or call us. We enjoy being a part of the National Hog Farmer Weekly Preview team.
Previous Production Preview columns can be found at www.nationalhogfarmer.com.
SMS Production Index
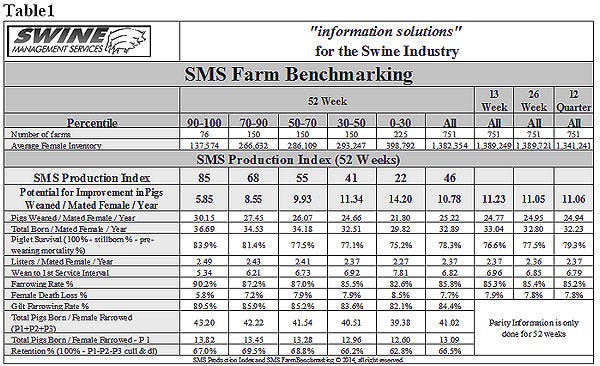
Table 1 provides the 52-week rolling averages for 11 production numbers represented in the SMS Production Index. The numbers are separated by 90 to 100%, the 70 to 90%, the 50 to 70%, the 30 to 50% and the zero to30% groups. We also included the 13-week, 26-week and 12-quarter averages. These numbers represent what we feel are the key production numbers to look at to evaluate the farm’s performance.
We appreciate input on topics for columns because we always need future ideas. So if you are a reader of our columns and have a question, just send us an e-mail or give us a call.
If you have questions or comments about these columns, or if you have a specific performance measurement that you would like us to write about, please contact [email protected] or [email protected].
You May Also Like


