How much are non-productive days affecting production at your farm?
Over last few years there have been more farms breeding fewer returns which is helping improve farrowing rates at those farms and lower MFNPD.
June 1, 2022
We are writing two articles looking at Non-Productive Days, what they are, how to lower them and what the cost of NPD are at your farm. With the increasing cost of feed ingredients and corn at $8 per bushel, farms need to be looking at ways to lower the cost to raise a weaned pig. We have heard from some producers that in the last year, the cost to raise a weaned pig has gone up as much as $11.00 per pig. A large part if this is increasing feed costs.
To understand NPD, you need to understand the definition of Non-Productive Sow Days:
Biological definition: any day that a gilt or sow of breeding age in the sow farm is neither gestating nor lactating.
Formula for calculating NPD: 365 – ((litters/female/year) x (gestation days + lactation days)).
Where are these NPD coming from? NPD are broken down into open replacement gilt days, wean to event days and returns to detected open days as follows:
Replacement gilts days: entry to first service, entry to culling and entry to death.
Weaning to event days: normal wean to first service, prolonged wean to first service which includes delayed wean to first service (skip heats), wean to cull, wean to deaths and anestrus
Returns to detected open days: detected open and reserviced, detected open at death and detected open at culling.
There have been several tables and charts developed for this article, and will be reviewed later in the article, which look at where farms are at with NPD, Mated Female NPD, and how they are affected by Wean to 1st Service Interval, Percent Repeat Services, Farrowing Rate and Farrow-to-Farrow Interval.
The data for this article comes from 562 sow farms in the SMS data base which represent 1,013,612 females. Farms used had to be at 20-plus pigs weaned/mated female/year and mature farms with seven-plus parity females. Farms with overly high repeat percentage and NPD, which was an indication of a major disease break, were eliminated.
There is a lot of difference from farm to farm in NPD, which is shown in Table 1 and Chart 1 for Non-Productive Days. Table 1 shows farms that were sorted by Pigs Weaned/Mated Female/Year on the Y-axis broken down from <22 pigs by one pig increment to >=32 pigs and the X-axis broken out by parity from P0-P7+.
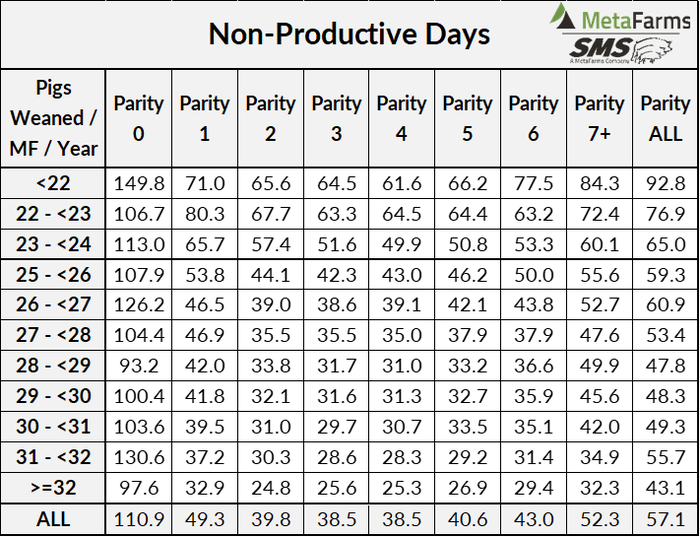
Chart 1 shows the Y-axis with NPD from 20-160 days and the X-axis by Pigs Weaned/Mated Female/Year broken out by parity. Table 1 shows the average NPD is 57.1 days with range of 43.1-92.8 days.
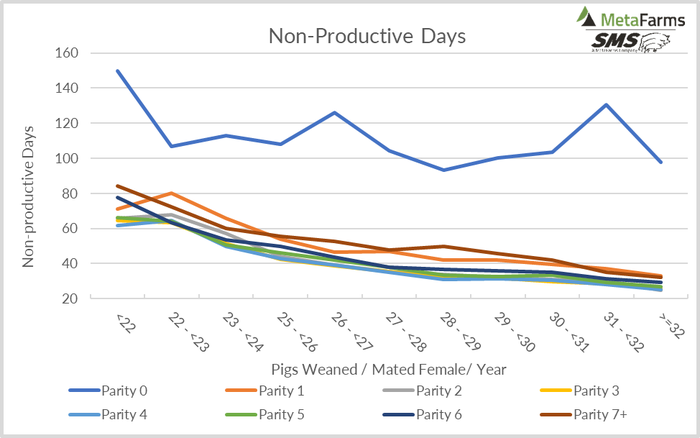
The areas that jump out are why are NPD so high for P0 female with average at 110.9 days, farms >32 at 97.6 days and days for farms <22 pigs at 149.8 days? Thoughts for higher days has always been an issue as to when gilts are entered into the farms' record keeping program with more farms entering gilts when they arrive at the farm and go into the gilt development unit or come out of isolation.
Since farms are inconsistent when they enter gilts, it has been hard to compare NPD across farms. To correct that issue, SMS created a line on the Farm Benchmarking report called Mated Female Non-Productive Days. This calculation corresponds to farms that enter gilts into records at first service for more accurate comparison of farms.
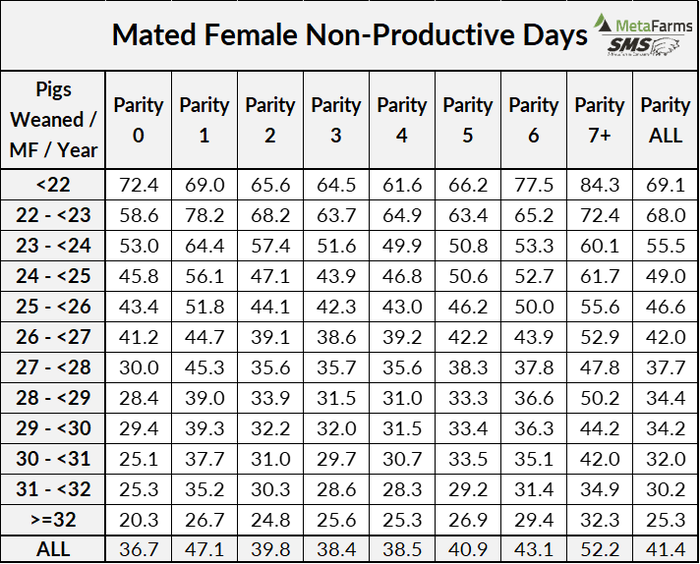
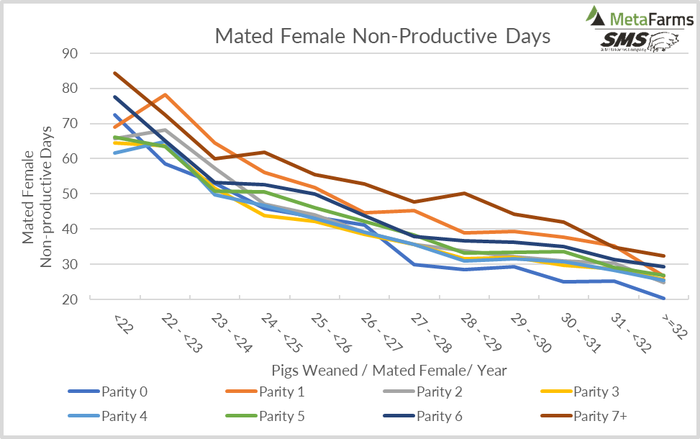
Table 2 and Chart 2 for MFNPD are set up like Table 1 and Chart 1. When you look at a comparison in NPD versus MFNPD, you see the average drops from 57.1 days to 41.4 days, an average drop of 15.7 days, and Non-Productive Days/Female/Year range from 25.3 to 69.1 days which is a difference of 43.8 days. The biggest change was P0 dropping from a 110.9-day average to 36.7 days with farms >=32 pigs at 20.3 days and farms <22 pigs at 72.4 days. By using MFNPD, the responsibility for lowering these open days is put back on the manager and staff at the farm.
As mentioned, the MFNPD are created in several areas of the farm with one area being Wean to 1st Service Interval. Table 3 and Chart 3 for Wean to 1st Serve Interval shows Table 3 having parity on X-axis going from 1-7+ parities and Y-axis being Pigs Weaned/Mated Female/Year going from <22 to >=32 pigs. Table 3 shows the average Wean to 1st Serve Days for these 562 farms for the last year is 6.51 days with farms <22 pigs at 9.46 days and farms >=32 pigs lower at 5.34 day. The biggest difference is P1 from 6.45 to 11.30 days. Chart 3 is set up with X-axis of Pigs Weaned/Mated Female/Year and Y-axis Wean to 1st Serve Days showing a drop in Wean to 1st Service Days as Pigs Weaned/Mated Female/Year goes up with P1's taking the longest time to return cycle after weaning.
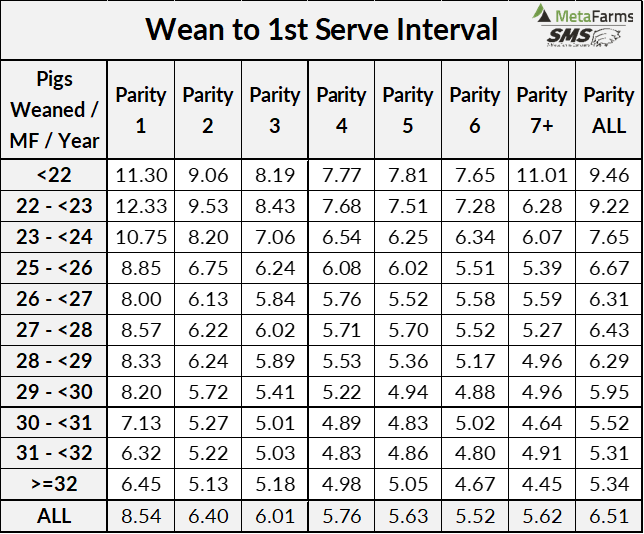
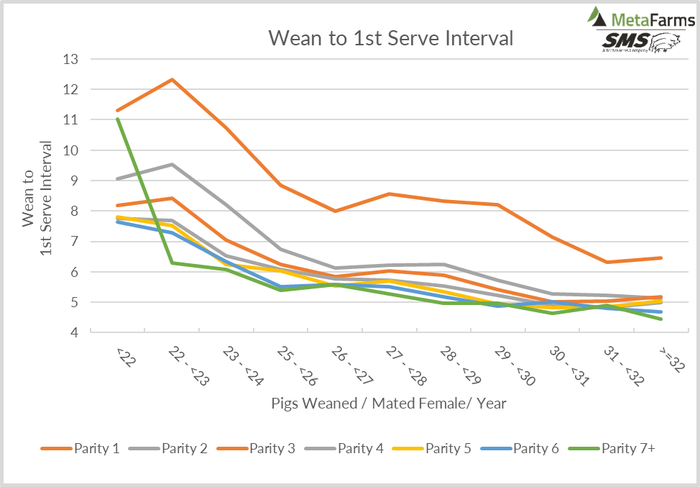
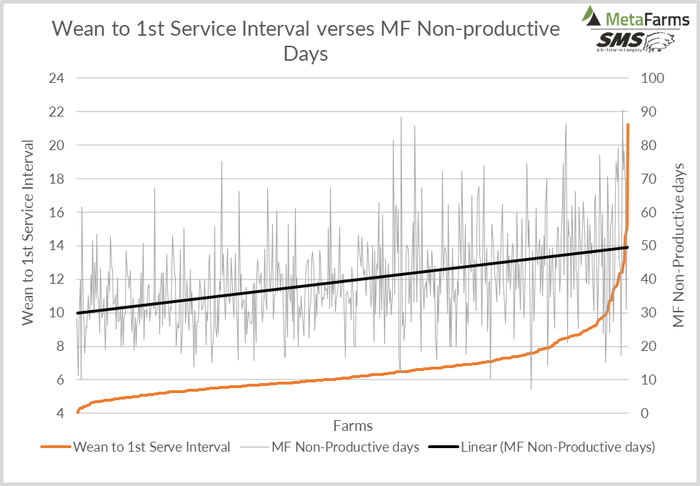
Chart 4 for Wean to 1st Serve Interval verses MF Non-Productive Days is set up to show the large amount of variation in Wean to 1st Serve Interval by farm. X-axis shows Wean to 1st Serve Interval for 562 farms with left Y-axis being Wean to 1st Serve Interval and right Y-axis being MF Non-Productive Days. As you see, Wean to 1st Serve days goes up as the number of MFNPD goes up.
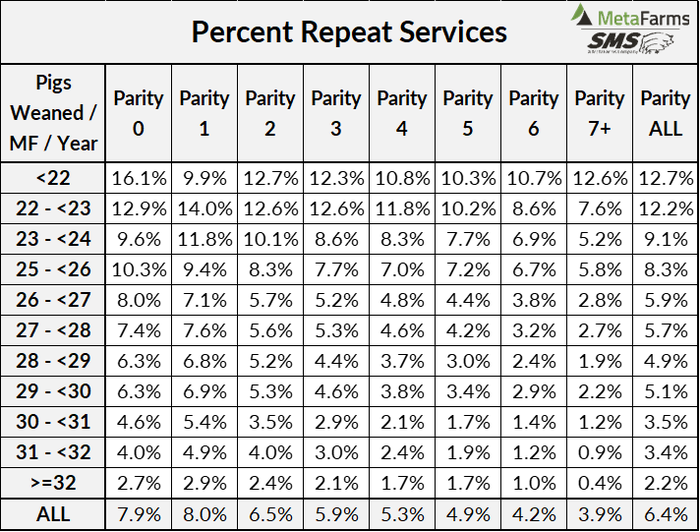
The area that increases MFNPD the most is when repeat service females are found after breeding and either culled, died or were rebred. Table 4 and Chart 5 for Percent Repeat Services shows Table 4 having on X-axis being Parity 0-7+ and Y-axis being Pigs Weaned/Mated Female/Year going from <22 to >=32 pigs. In that table, average repeats at 6.4% with top farms >=32 pigs at a low of 2.2% up to farms <22 pigs at 12.7%.
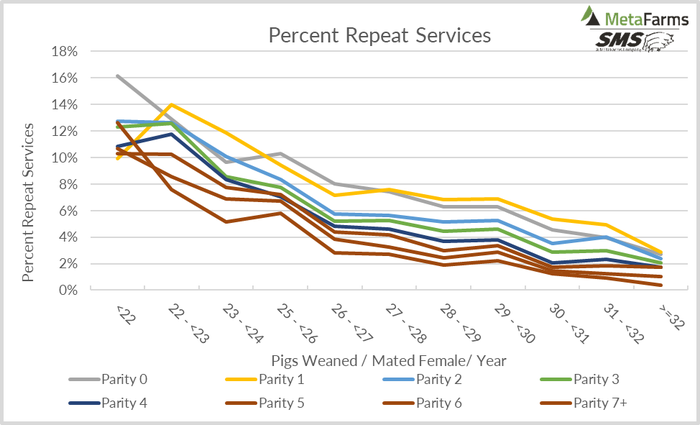
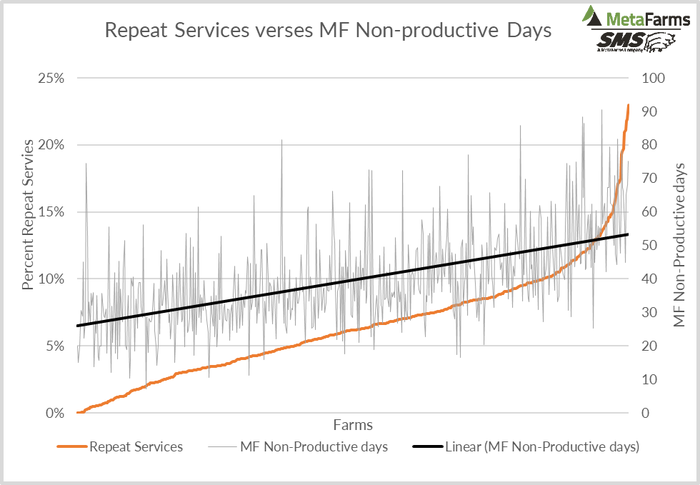
When you look in more detail at farms breeding returns, there were 77 farms (12.5%) breeding a low 0-<2% repeats, 151 farms (26.9%) breeding from 2-<5%. Over the last few years there have been more farms breeding fewer returns which is helping improve farrowing rates at those farms and lower MFNPD. Chart 5 is laid out with Pigs Weaned/Mated Females/Year broke out by parity on the X-axis and Percent Repeat Services in the left Y-axis. This chart shows as Pigs Weaned/Mated Female/Year goes up, the number of returns bred goes down and older parity returns are being culled at a higher percentage. Chart 6 is set up with the 562 farms from the data on X-axis from farms breeding 0.0% returns up to 24.5% which reflects as repeats go up, so does MFNPD.
Farrowing Rate is another area that influences MFNPD with data in Table 5 and Charts 7 and 8 for Farrowing Rate. Table 5 is set up with X-axis broken out by parity from 0-7+ and Y-axis showing Pigs Weaned/Mated Female/Year. Table 5 shows a lot of variation in farrowing rate with farms <22 pigs at 76.5% up to farms >=32 pigs at 90.4% with average at about 85.0%. If you look at the Parity 0 column, farrowing rate goes from 73.2% to 91.3% with target being 90+%. Remember that 20-30% of all services are P0 females. Farrowing rate variation by parity shows low average variation with Parity 1 at 84.1% up to 86.2% for Parity 4.
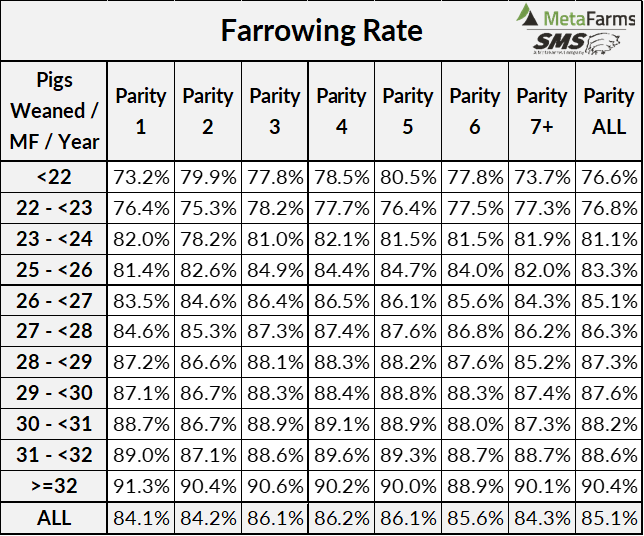
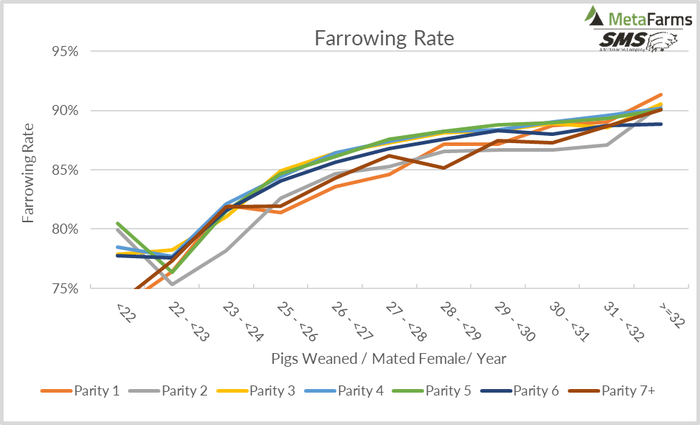
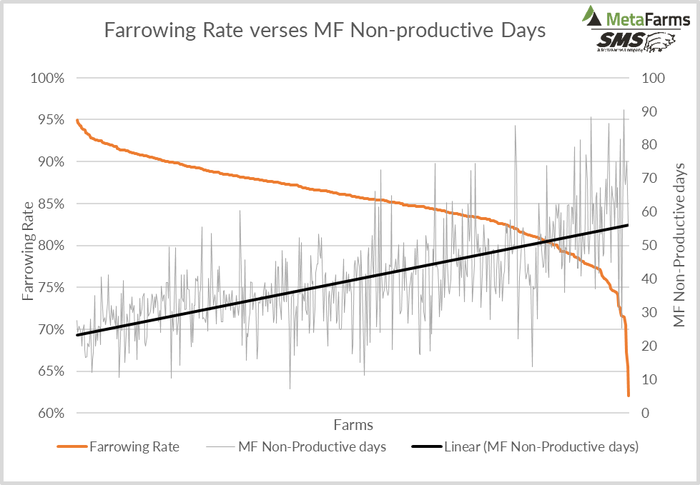
Chart 7 is set up with X-axis being Pigs Weaned/Mated Female/Year broke out by parity 0-7+ and Y-axis being Farrowing Rate. This chart shows again how important improving farrowing rate does for overall farm performance with a 1% change in farrowing producing 0.34 more Pigs Weaned/Mated Female/Year. Chart 8 is set up with Farrowing Rate verses MF Non-productive Days. Farms on the X-axis starting with highest Farrowing Rate at 95% going down to <65% with left Y-axis being Farrowing Rate and right Y-axis being MFNPD. There is a direct relationship as farrowing rate improves, MFNPD go down.
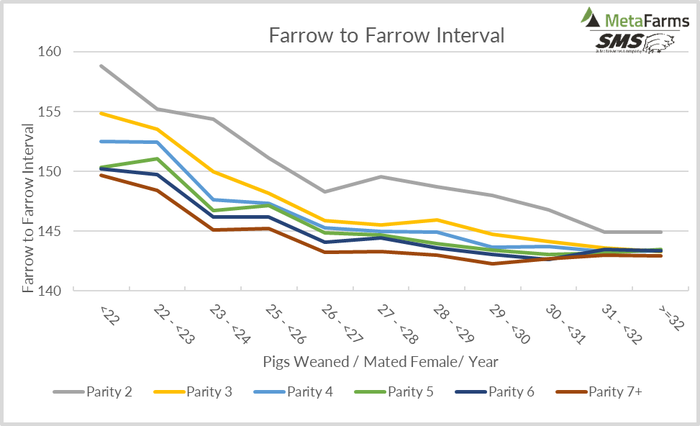
The final area to look at for MDNPD is in Table 6 and Chart 9 for Farrow to Farrow Interval. Table 6 is broken out with parity 0-7+ on the X-axis and Pigs Weaned/Mated Female/Year on Y axis going from <22 pigs to >=32 pigs. Average Farrow to Farrow Interval is 146.2 days with top farms at 143.7 days and farms at <22 pigs at 153.8 days. The days are longer probably do to lower farrowing rate which increases the number of repeats and farms taking longer to find repeats in gestation or culled from the farm.
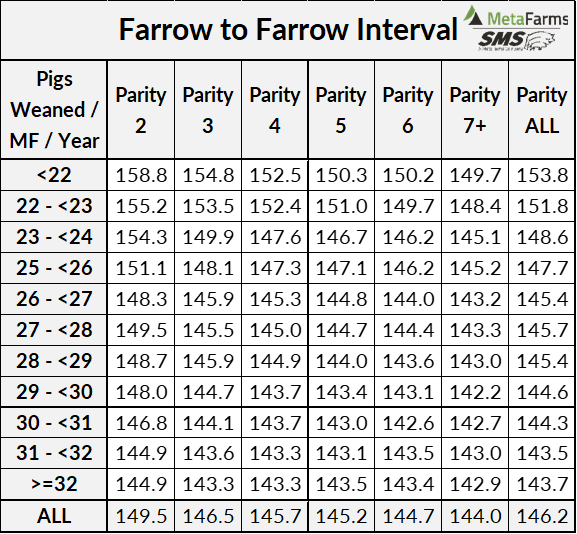
Chart 9 is set up showing X-axis with Pigs Weaned/Mated Female/Year broke out by parity and Y-axis being Farrow to Farrow Interval. What jumps out, as you would expect, is days for Parity 2 females is higher than the females at Parity 1 taking longer to cycle after weaning, lower farrowing rate and more returns adding to the open sow days.
In summary, data from 562 farms shows average NPD days last year at 57.1 with top farms at 43.1 days and farms <22 pigs at 92.8 days. As mentioned in the article, SMS likes to use MFNPD which makes it easier to compare farms taking out the developing gilts. MFNPD shows an average at 41.4 days with ranges for farms >=32 pigs at 25.3 days verses farms <22 pigs at 69.1 days. Tables and charts showed that open days are affected by Wean to 1st Service Days, Percent Repeat Services, Farrowing Rate and Farrow to Farrow interval with a lot of variation by parity and Pigs Weaned/Mated Female/Year.
What does you record program show your farm has for NPD and MFNPD? Have you looked at the areas discussed, and do you know where your farm can lower open days? Do you know what your cost per day is for a single NPD?
In the article for July, there will be information on the cost of NPD and MFNPD and discussion on how to lower open sow days which will reduce costs at the farm and when they are greatly needed.
Thank you for reading this article. If you have other topics that you would like reviewed, please let SMS know.
Source: Ron Ketchem and Mark Rix, who are solely responsible for the information provided, and wholly own the information. Informa Business Media and all its subsidiaries are not responsible for any of the content contained in this information asset.
You May Also Like
