Here’s how the U.S. differs from Canada in culling sows
Hog producers are encouraged to participate in sow housing study.
Last month we took a look at when sows are dying, and this month we are following that up with when are they being culled. We used the same 37 sow farms with approximately 88,000 sows. We again used the measurement of days since served to look at the data. One thing to keep in mind is that while deaths are recorded on the day that they happen in most instances there are many farms that document the sow as culled using the day they decide that she will be culled and not the day that she actually leaves the farm. In this dataset, 9.6% of the culls occurred on the day they were weaned. When looking at individual farms, it ranged from 0% to 64.91%. There are advantages and disadvantages to both recording methods and wanted to point out the variation within these farms.
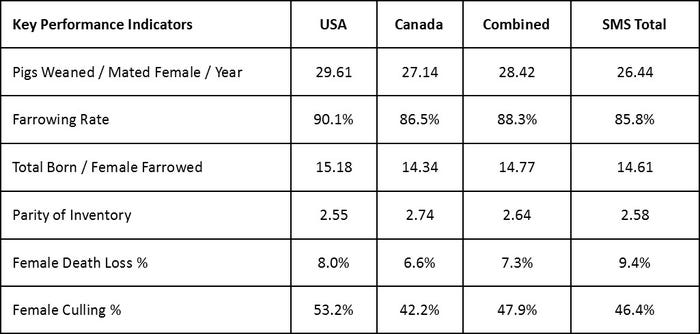
In Table 1 we have the same key performance indicators from last month’s article with the addition of Female Culling %. There are more differences in what is happening between the USA and Canada than there was from a death loss standpoint.
Table 1
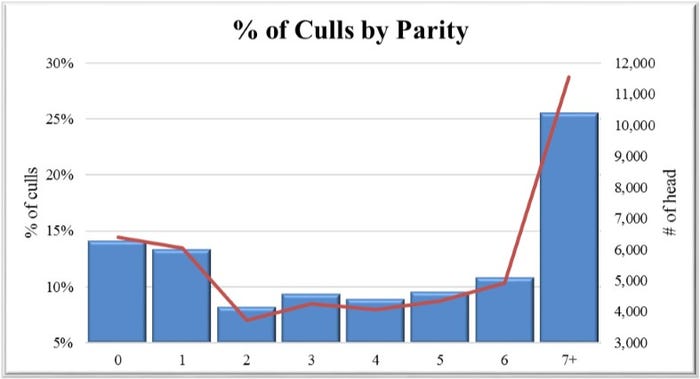
Looking at the percentage of culls by parity, it shows a similar trend to death loss (refer to Chart 1). While just over 25% of the culls come in sows that are parity 7 or older, the next two highest parities are gilts and parity 1 sows.
Chart 1
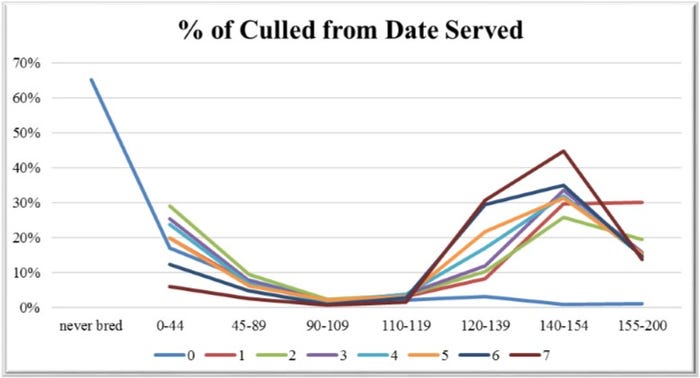
When breaking it out a step further to look at parity in combination with days from being served, 65.2% of the gilts that were culled in this dataset were never bred (refer to Chart 2). This drastically drops off for gilts. However, there were 2.1% of the gilts that were culled 140 to 200 days after they were first bred without ever farrowing. When you look at parity 1 females, there are 30.2% culled at day 155 to 200 after being served. To put this in perspective a bit if she farrowed at day 116 and lactated for 20 days that total 136 days and between 19 and 64 days later she was culled. That is probably not terribly out of line. However, there are still 13.8% of the P7+ category that falls into the category of being culled between day 155 and 200.
Chart 2
In Chart 3 we combined the percent of deaths and percent of culls compared to total removal during the time period to look at the overall timing of losses. 60.5% of the total losses occur between day 120 and 200 days after being served.
Chart 3
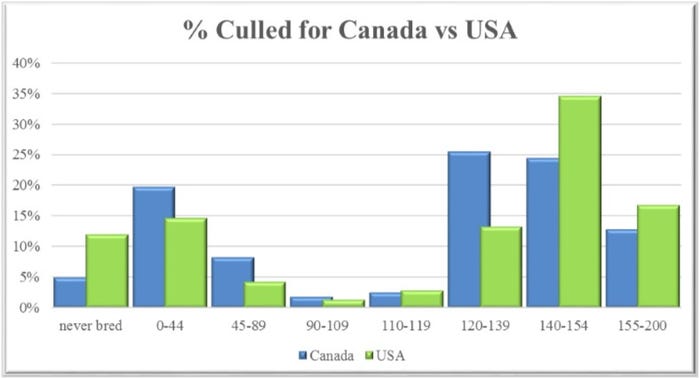
Chart 4 looks at the timing of removals for both the farms in Canada and the United States, some differences in timing here with Canada having a lower percentage culled at 42.2% for the last 12 months compared to the United States subset at 53.2%. The farms in the Canadian subset are culling fewer that were never bred at 5.0% compared to the USA subset at 12.1%. The Canadian farms are getting 25.4% culled between day 120-139 compared to the United States at 13.3%. This is likely due to the difference in wean age between them; the Canadian farms average 18.8 days while the U.S. farms averaged 21.3 days.
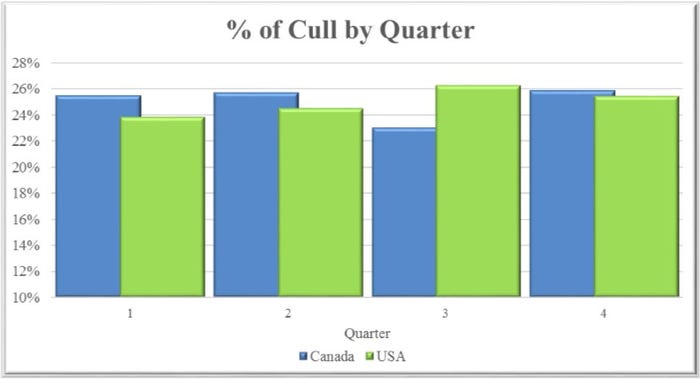
When breaking the data out by a quarter in Chart 5 there really is no difference with about 25% being culled each quarter of the year; this is what was observed in the death loss data as well.
Chart 5
The financial impact of culling young sows before they have been able to recover their cost is draining on a sow farm. Also taking into account the financial impact that the offspring of gilts are outperformed by all other parity offspring in the growing phase it has an even greater impact on the industry as a whole.
Invitation to participate
SMS and the University of Nebraska are working together on an extensive sow housing study. This study is open to all farms in the United States and Canada that have been operating for at least three years and using the same housing system for one year. There is an extensive survey to fill out as well as submitting your production data file. If you are interested in participating in this project, contact Benny Mote by phone at 402-310-9878 or email at [email protected] or Valerie Duttlinger with Swine Management Services by phone at 812-430-5969 or email at [email protected]. All data must be submitted by Aug. 1 to participate in this study.
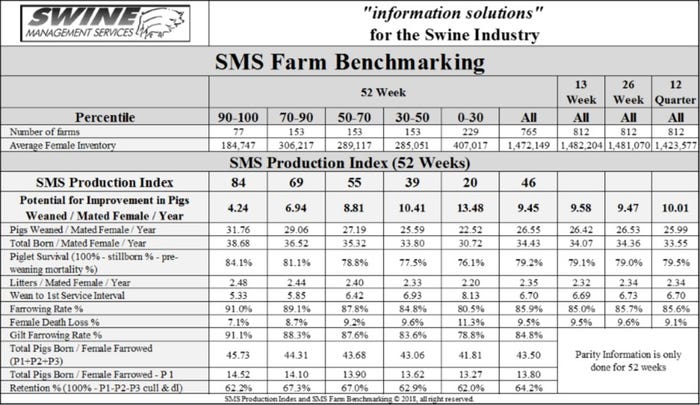
Table 2 provides the 52-week rolling averages for 11 production numbers represented in the SMS Production Index. The numbers are separated by 90-100%, the 70-90%, the 50-70%, the 30-50%, and the 0-30% groups. We also included the 13-week, 26-week and 12-quarter averages. These numbers represent what we feel are the key production numbers to look at to evaluate the farm’s performance.
Table 2
At SMS, our mission statement is to provide “Information solutions for the swine industry.” We feel with the creation of different SMS Benchmarking databases for all production areas we now have more detailed information to share with the swine industry. If your farm would like to be part of the SMS Benchmarking databases, or if you have suggestions on production areas to write articles about, contact Mark Rix, Ron Ketchem or Valerie Duttlinger. We enjoy being a part of the NHF Daily team. Previous columns can be found at NationalHogFarmer.com.
About the Author(s)
You May Also Like


