Does size matter when it comes to farms?
What is much more important than the size of the farm is the people in the farm, their drive to perform at a high level, focus on biosecurity and economic efficiencies.
At World Pork Expo we were involved in several conversations that revolved around the size of a farm, the perceived advantages that a small farm or a big farm has. That drove us to look at what the numbers are telling us about the size of operations.
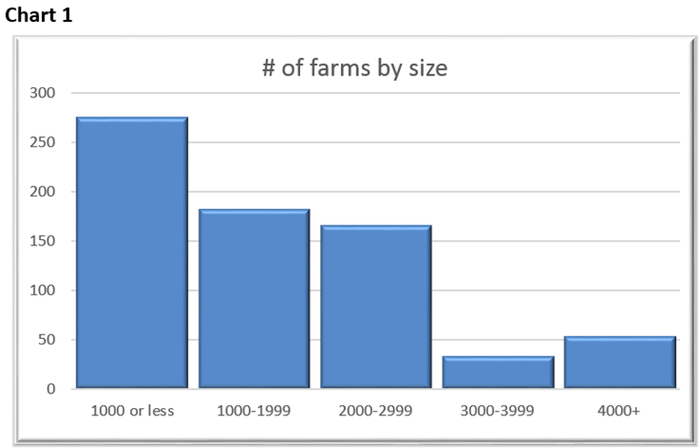
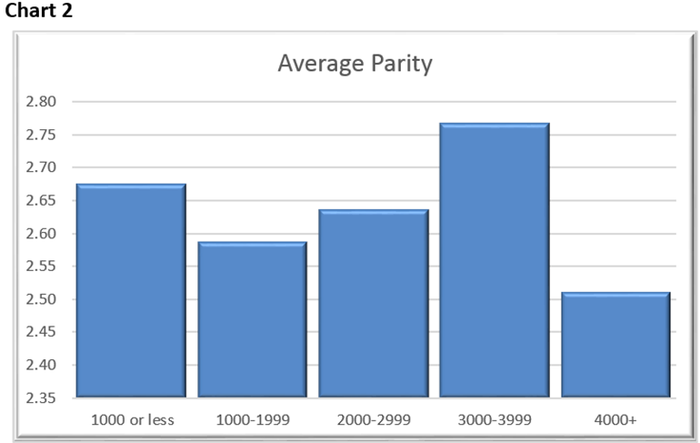
We pulled 700 farms with an average parity of greater than 1 out of the database to look at if size of farm matters. Chart 1 shows the number of farms by size. Most of the sow farms in our database are still 1,000 or less mated females. Chart 2 shows the average parity by farm size, the 4,000-plus farms being the lowest at 2.51 while those in the 3,000s were the highest at 2.77, just a 0.26 difference from top to bottom.
In Chart 3 the average farrowing rate is graphed showing those farms at 4,000-plus sows the highest at 86.9% with the 3,000s being the lowest at 84.6%, again seeing very little variation based on the averages.
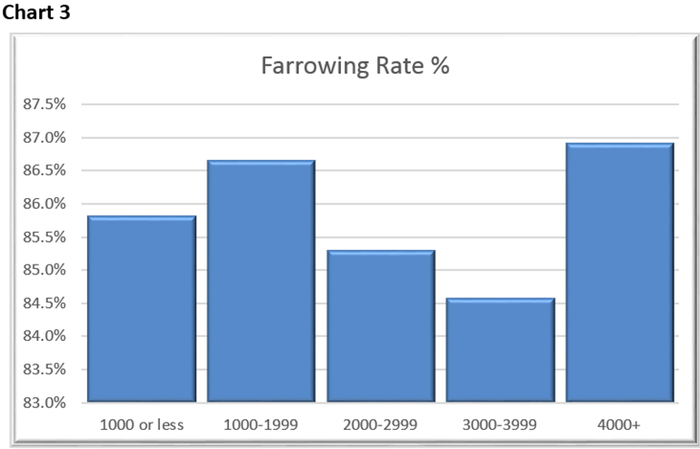
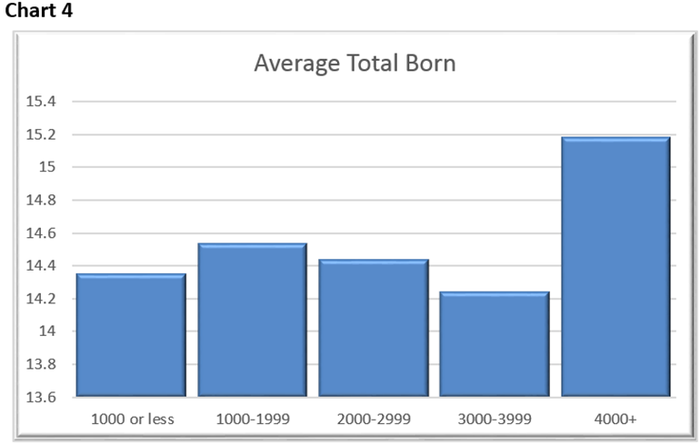
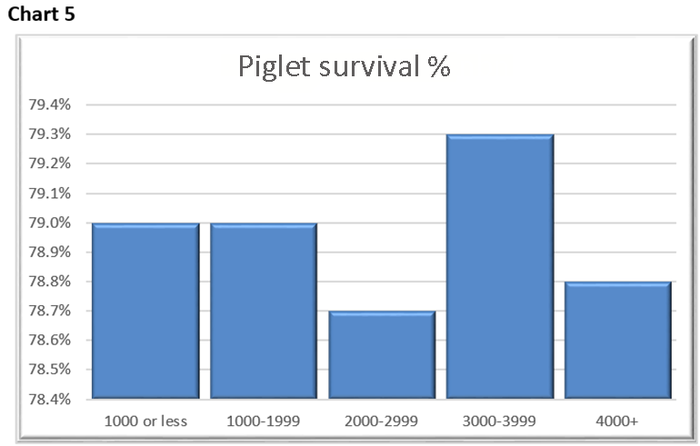
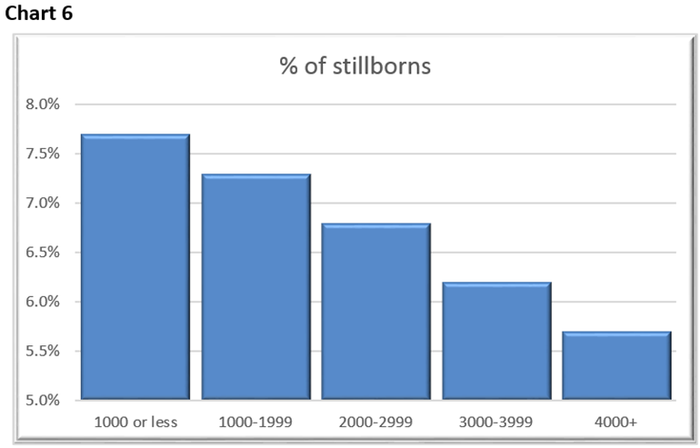
Chart 4 looks at average total born with those at 4,000-plus averaging 15.18 and again those farms in the 3,000s the lowest at 14.25. Chart 5 looks at Piglet Survival which is calculated as 100% minus the percent of stillborns and minus the percent of preweaning mortality. The farms in the 3,000s range now have the advantage at 79.3% but only a slight advantage with again a very narrow range in performance with just 0.7% difference between the top and the bottom. However, when we look at stillborns in Chart 6 there is more variation and the clear advantage is to the bigger farms.
In Chart 7 it looks at sow death loss, and the advantage there goes to the smaller farms, farms with less than 1,000 sows averaging 7.5% while those at 4,000-plus average 10.6%. Although there are farms in each category under 5% and over 20%.
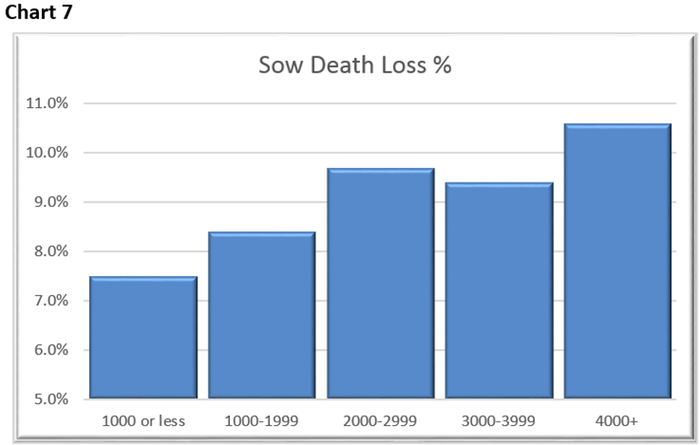
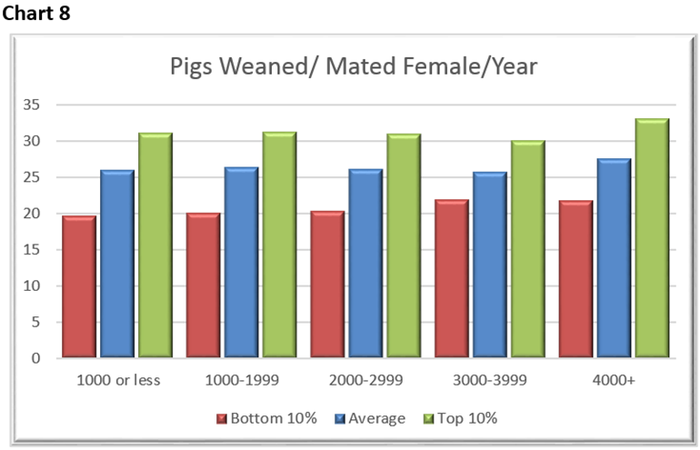
When we look at pigs weaned per mated female from an average standpoint those farms at 4,000-plus sows have the advantage at 27.7 while those farms in the 3,000s are the lowest at 25.85. Chart 8 looks at the averages as well as the bottom 10% and top 10% for each category. Each category has the top 10% of the farms weaning over 30 pigs per mated female per year, sending the message that you don’t have to be big to have great performance.
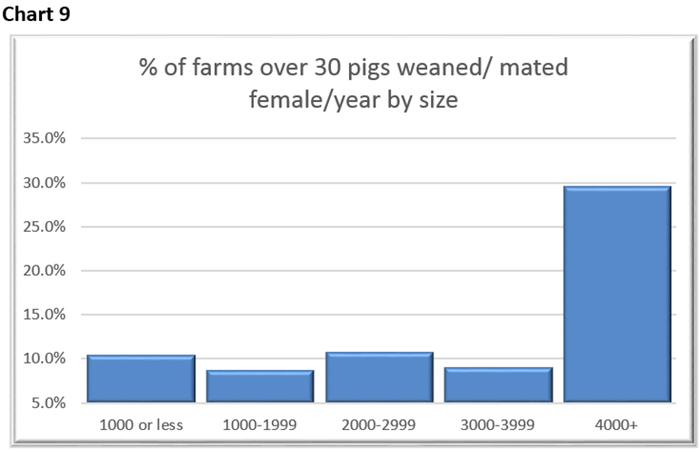
At the same time, Chart 9 shows almost 30% of the farms over 4,000 sows were achieving greater than 30 pigs weaned per mated female while the rest of the categories are right around 10%. An important thing to note is that in those farms over 4,000 sows there were a total of 54 farms and only 24 companies owning those animals. While larger farms do have some advantages especially in the ability to extend farrowing hours to have more sows and newborns being assisted, there are other challenges that come with a unit of that size. Large companies also have the advantage of having in-house consultants to keep up on the latest advances in pig production and work with the farms to implement the changes needed.
At Swine Management Services we strive to keep up with all the latest advances in pig production and share that knowledge with our clients and implement those changes with their farm employees. We also share the knowledge by writing these columns. If you would like to learn more about implementing the changes for your farm please contact SMS.
So, does size matter? In some ways it does, but what is much more important than the size of the farm is the people in the farm, their drive to perform at a high level, focus on biosecurity and economic efficiencies.
Sow housing study
SMS and the University of Nebraska are working together on an extensive sow housing study. This study is open to all farms in the United States and Canada that have been operating for at least three years and using the same housing system for one year. There is an extensive survey to fill out as well as submitting your production data file. If you are interested in participating in this project, contact Benny Mote at 402-310-9878 or Valerie Duttlinger with SMS at 812-430-5969. All data must be submitted by Aug. 1 to participate in this study.
SMS Production Index
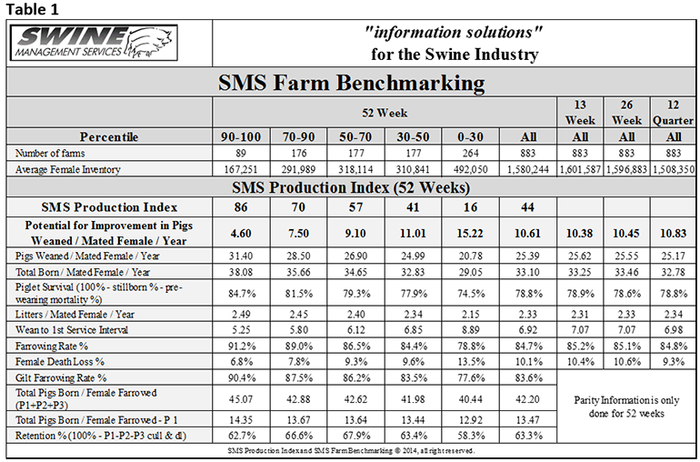
Table 1 provides the 52-week rolling averages for 11 production numbers represented in the SMS Production Index. The numbers are separated by 90-100%, the 70-90%, the 50-70%, the 30-50% and the 0-30% groups. We also included the 13-week, 26-week and 12-quarter averages. These numbers represent what we feel are the key production numbers to look at to evaluate the farm’s performance.
At SMS, our mission statement is to provide “Information solutions for the swine industry.” We feel with the creation of different SMS Benchmarking databases for all production areas we now have more detailed information to share with the swine industry. If your farm would like to be part of the SMS Benchmarking databases, or if you have suggestions on production areas to write columns about, please contact Mark Rix, Ron Ketchem or Valerie Duttlinger. We enjoy being a part of the NHF Daily team.
About the Author(s)
You May Also Like

