Does farm size matter in swine production?
February 8, 2016
This month we decided to look the influence of farm size on production. Is there an ideal farm size? Is it easier to staff and manage a small or large farm?
Data being used came from the Swine Management Services database with data from 674 farms being used. Farms had to be at 22-plus pigs weaned per mated female per year and current for the last 52 weeks. Farm size variation ranges from 110 to 10,000-plus sows. Farms that had any health issues the last 52 weeks were not deleted from the data set.
There were 299 farms under 1,000 sows (44.4%), 154 farms at 1,000-1,999 sows (22.8%), 137 farms 2,000-2,999 sows (20.3%), 37 farms 3,000-3,999 sows (5.5%) and 47 farms at 4,000-plus sows (7.0%). The average of pigs weaned per mated female per year for the 674 farms was 26.28 pigs with a range of 22.01 to 34.05 pigs. When you look at the average for each farm size breakdown the average is about the same and the range about the same with 10-plus pig variation.
Looking at Chart 1, Pigs weaned per mated female per year, the chart is set up with individual farms on the X-axis starting with smallest farm on the left and the largest on the right. The Y-axis has the range of pigs weaned per mated female per year starting at 22 and going to 34 pigs. The chart shows a lot of variation farm-to-farm. The black line is the trend line.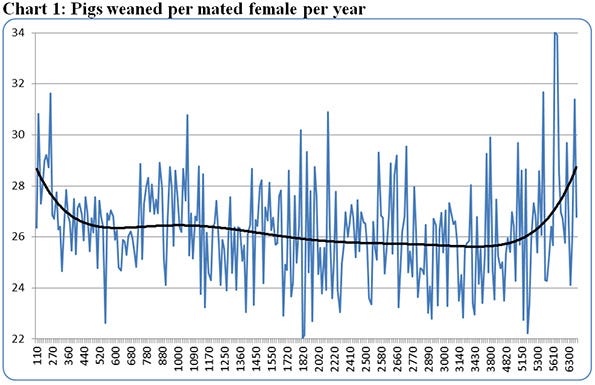
Looking at the chart you see the small farms and large farms (4,000-plus sows) have the highest number of pigs produced. Why are these farms producing more pigs per mated female? Some thoughts are the smaller farms are more family farms that do not have to hire outside labor and the larger farms which are mostly run by hired labor may be able to employ some management practices like extending hours someone is attending sows farrowing, or dedicate more labor to specific areas like gilts development.
The data show more sow farms now at 30-plus pigs weaned per mated female per year.
Chart 2, Total born per mated female per year, shows the potential that farms have for producing pigs with farms as low as 25 pigs to up to 41 pigs. How long will it be before we see a farm at 39-plus pigs weaned per mated female per year? The most potential is for a few small farms and several of the larger farms. I know that the larger farms are committing more dollars and labor toward gilt development which is the key to improving production numbers.
Farrowing rate is in Chart 3 with the average of the 674 farms at 86.2% with a range of 72.0 to 95.9%. Once again the farms with the highest farrowing rate are the smaller and larger farms. However, there is not as much variation as you see in some of the other charts, just a lot of farm-to-farm variation. Data show the biological limit for farrowing rate is 95-96%.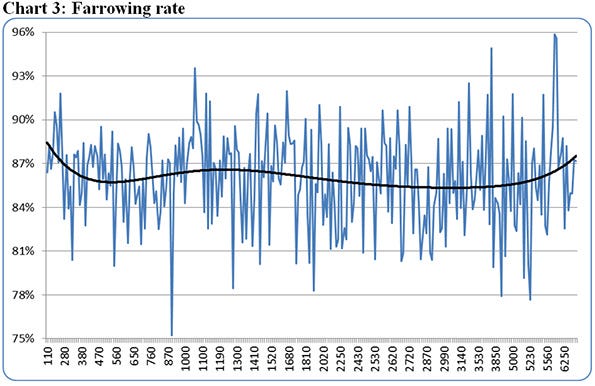
Chart 4 shows the Total born per female farrowed for the 674 farms ranged from 10.53 to 16.96 pigs with an average of 14.00 pigs. This chart shows several farms at 15-plus pigs total born with the trendline showing the biggest farms with the higher total born numbers.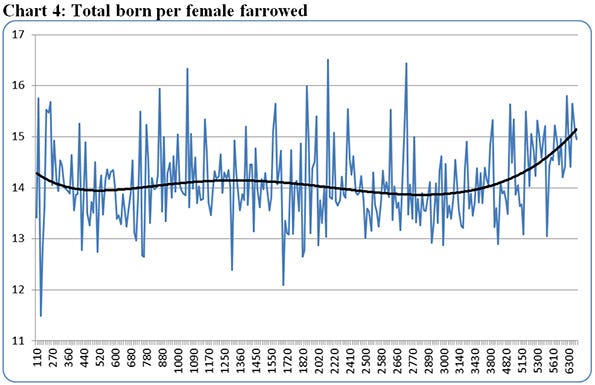
As the farms are farrowing higher total pigs born, what is going on with stillborns and pre-weaning death loss. In Chart 5, Stillborn per female farrowed, you see stillborns for these farms the last 52 weeks averaged 0.99 pigs per litter. There is a lot of variation from farms at 0.26 pigs to a farm at 2.53 stillborns. Even with a major disease break, the 2.53 pigs per litter for 52 weeks is very high. The higher stillborns appear to be from the smaller farms which probably do not have extended farrowing hours versus the larger farms showing the lower stillborn numbers.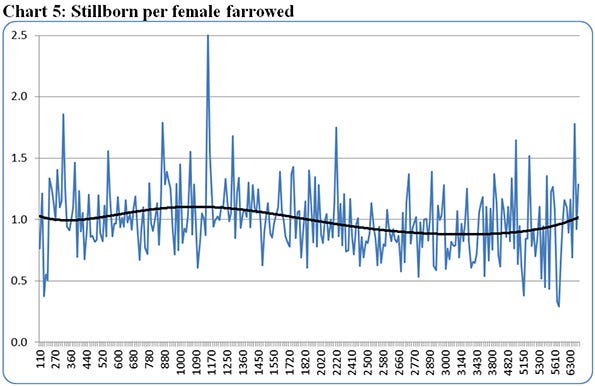
If the farm is able to have someone in farrowing attending sows for 18 hours per day they will be able to attend about 85% of the farrowing. That is how many farms are weaning those extra pigs. Next time you are in farrowing you need to weigh a few stillborns pigs and will probably see weights of 2.7-plus pounds. These are the pigs you need to be saving by providing more labor in farrowing.
The other part of farrowing house management is pre-weaning mortality which is shown in Chart 6. Average pre-weaning mortality is at 12.68% with a range of 2.2 to 28.8%. When you look at the trendline it is going up as farms get bigger. This does make some sense as the larger farms are having higher total born pig numbers. We have seen over the last few years as total born has gone up so have pre-weaning mortalities. Farms that have not been able to change or are unwilling to change how they manage the farrowing area are now losing more pigs. You see a few of the large farms turning this trendline down. These farms are adding more people to farrowing usually by adding a second and even sometime a third shift in farrowing so there are people there helping sows farrow, sleeving more sows, drying pigs, getting them sucking and finish off by doing split suckling of the litter of pigs.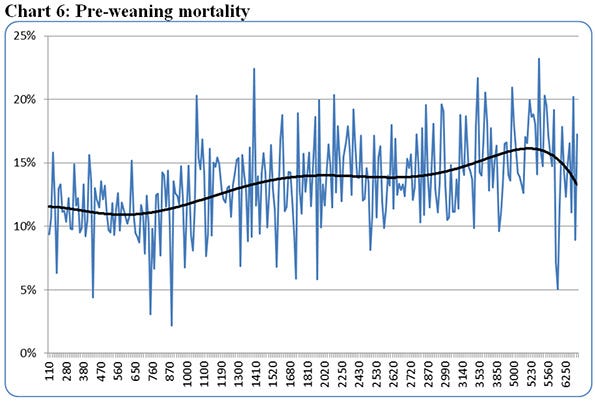
Chart 7, Piglet Survival, shows a combination of stillborns and pre-weaning mortality percent. So this number does not care how the dead pigs are recorded. The average for the 674 farms for piglet survival is at 80.3% with range of 63.7% to 95.7%. The trendline shows as the farms get bigger, piglet survival goes down except for the few that have figured out how to save those extra pigs with extra labor in farrowing.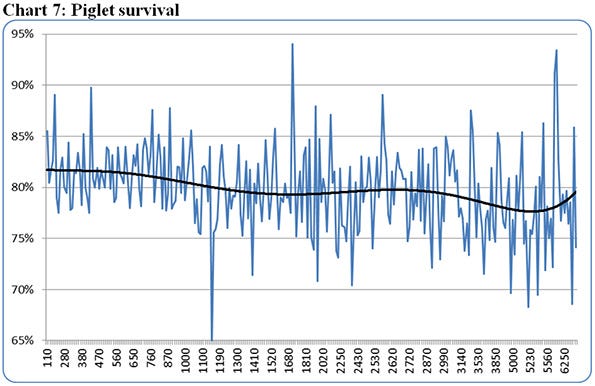
Chart 8, Pigs weaned per female farrowed for the 674 farms had an average of 11.08 pigs with range of 8.47 to 13.57 pigs weaned. The farms that are loading up the sows with more pigs at farrowing time are seeing the newer genetics can handle more pigs and have the ability to wean those pigs. In looking at the trendline the smaller and larger farms are weaning more pigs per female farrowed.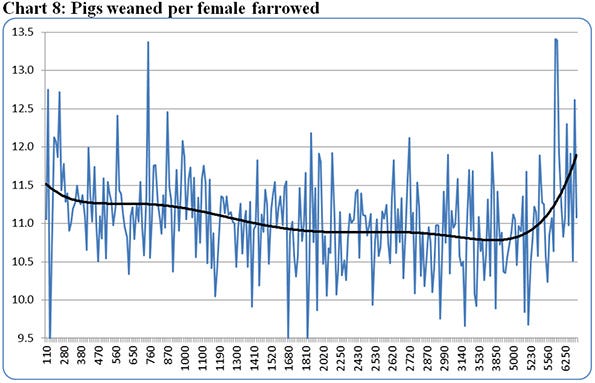
As you see, size of farm does have some effect on production numbers. However, it is the smaller and larger farms that have made changes to management that are taking advantage of the improved genetics and weaning those extra pigs. Where does you farm fit in?
SMS Production Index
Table 1 provides the 52-week rolling averages for 11 production numbers represented in the SMS Production Index. The numbers are separated by 90-100%, the 70-90%, the 50-70%, the 30-50% and the zero-30% groups. We also included the 13-week, 26-week and 12-quarter averages. These numbers represent what we feel are the key production numbers to look at to evaluate the farm’s performance.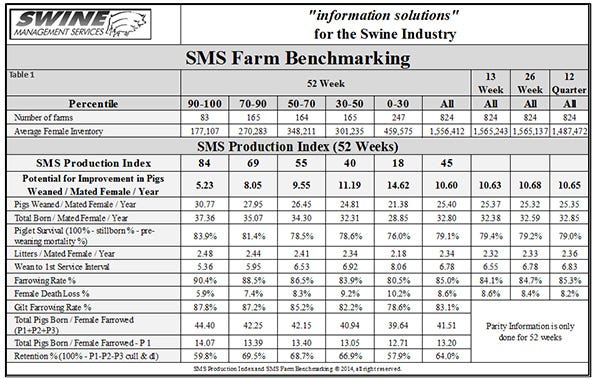
At SMS, our mission statement is to provide “Information solutions for the swine industry.” We feel with the creation of different SMS Benchmarking databases for all production areas we now have more detailed information to share with the swine industry.
If your farm would like to be part of the SMS Benchmarking databases, or if you have questions or comments about these columns, or if you have a specific performance measurement that you would like us to write about, please contact [email protected] or [email protected]. We enjoy being a part of the National Hog Farmer “Weekly Preview” team. Previous Production Preview columns can be found at NationalHogFarmer.com.
You May Also Like


