Are we measuring the right thing?
If the numbers are hard to compare why would we even look at them? That’s because the economic impact each number carries on the farm is different.
There are many different numbers that can be used to rank the overall performance of a farm. The most common are some form of pigs weaned per mated female or pigs per sow per year and there are many variations of those equations. However, are those the best numbers to use? What other numbers should be looked at?
With the help of Ken Stalder at Iowa State University we used some farms from our database to look at two other numbers, and how they compare to pigs weaned per mated female per year that we use today, pigs per day per 100 sows and pigs per sow lifetime. For both of these calculations we took all females removed in the last eight years from 15 different farms and looked at their lifetime productivity. There are some issues with comparing these numbers due to how gilts are entered; these issues were outlined in this column from August. Gilts are only a factor in pigs weaned per mated female if they were bred.
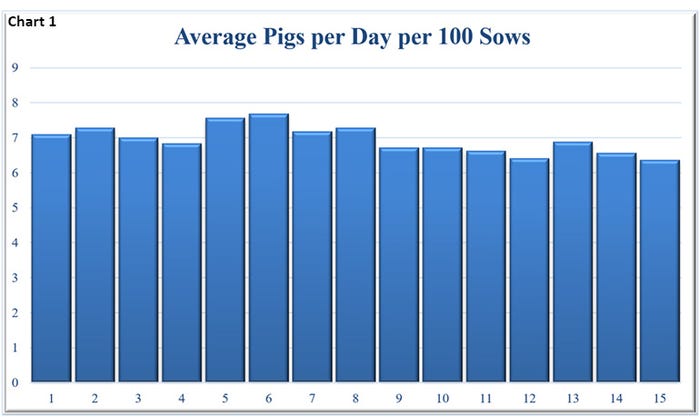
Pigs per day per 100 sows
This calculation considers any female culled in the last eight years and the number of days that she was in the herd. The total number of pigs weaned from those sows was divided by the total number of days those removed sows spent in the herd, not an average for each sow, and then multiplied by 100 sows because of the small number. Chart 1 shows the result for each of the 15 farms. The farms ranged from 7.69 to 6.36 pigs per day per 100 sows.
Pigs per sow lifetime
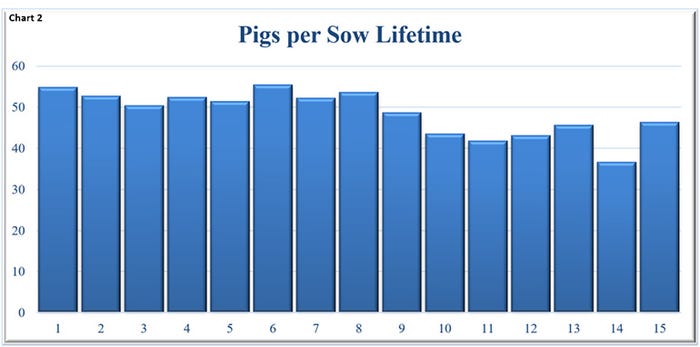
This number was calculated on the same number of females, all removed in the last eight years. The total number of weaned pigs over the last eight years from those sows was divided by the number of sows removed to get an average for the farm. Chart 2 shows the results for the 15 farms ranging from 55.49 to 36.72.
Pigs per mated female per year
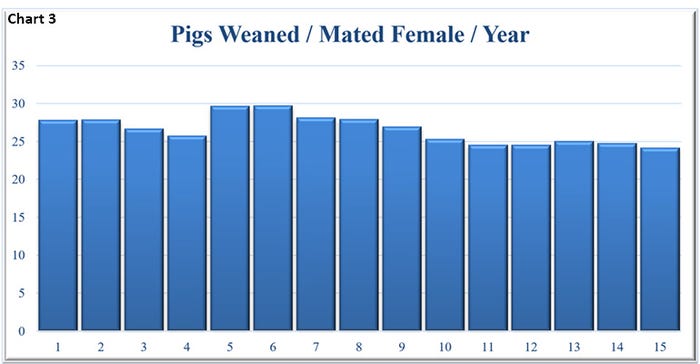
Chart 3 shows the eight-year average for the farms for pigs weaned per mated female per year calculation. This calculation is based on National Pork Producers Council financial standards.
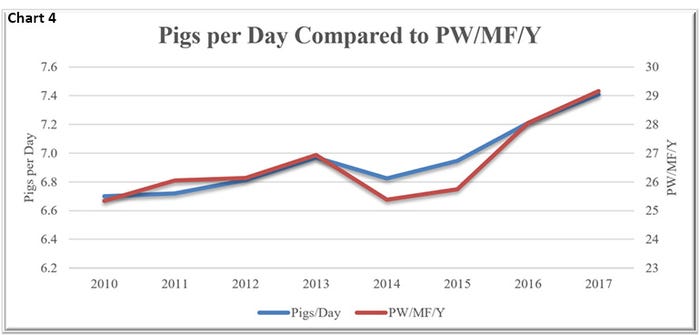
It is difficult to compare all of these numbers and how a farm performs in each area due to the variation in the range of numbers. In Chart 4, the blue line reflects the pigs per sow per day over the eight years on the left axis, while the right axis and red line reflect pigs weaned per mated female per year. The lines are relatively close to each other when we look at an average of the 15 farms.
If the numbers are hard to compare then why would we even look at them you may be asking, that is because of the economic impact each number carries on the farm is different. Pigs weaned per mated female per year does not consider any gilt performance while both pigs per sow lifetime and pigs produced per day do. Pigs per sow lifetime only considers gilts if they are entered into the sow record program while pigs per day per 100 sows considers the days, not just the gilts in the herd, of all females. At a cost of $2.50 per nonproductive day this certainly has an impact on the bottom line of a farm.
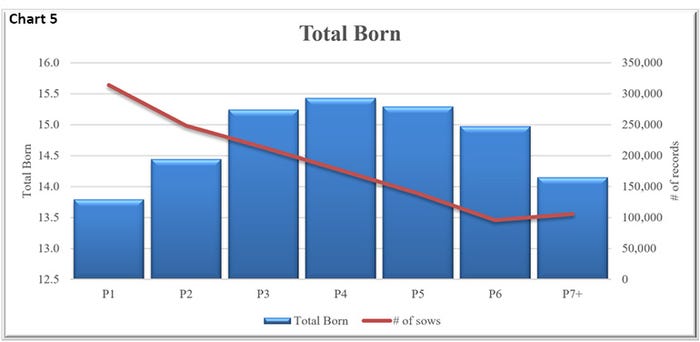
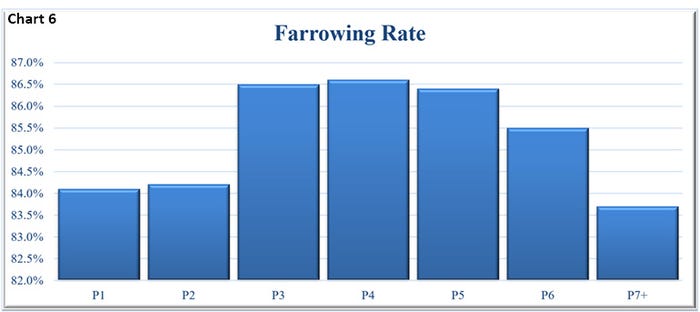
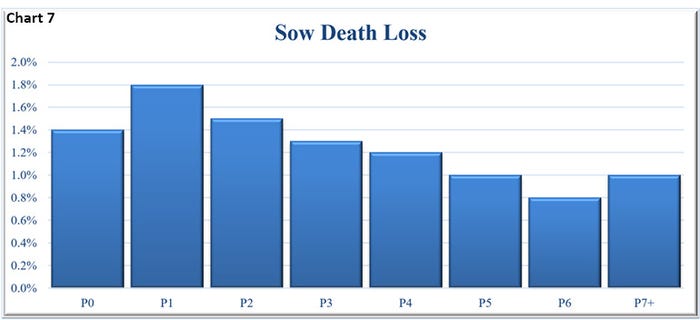
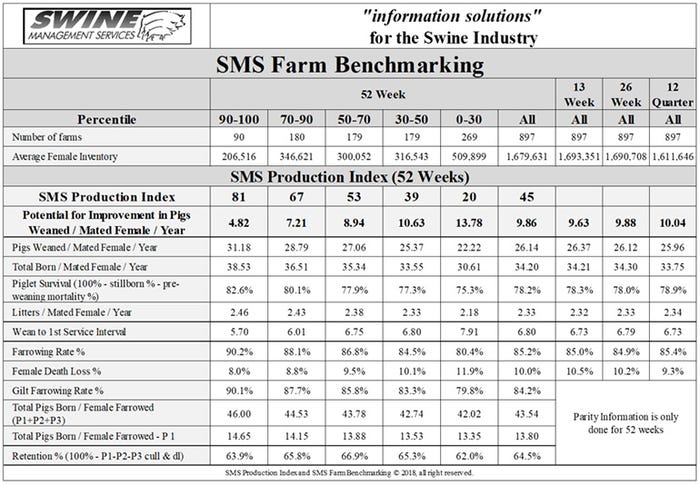
When you consider the difference in performance by parity this is also an important economic consideration. Chart 5 shows the total born (blue) for the last 52 weeks for the SMS database of 875 farms and 1,567,100 mated females (orange — by parity). P1 sows have lower total born at 13.79 than any other parity and while our database shows that as P5 total born starts to decline, all parities are still averaging more than the P1s. Chart 6 looks at the difference in farrowing rate by parity, again gilts are considerably lower than Parity 3 and Parity 4s, but P7+ are actually the lowest. Chart 7 shows that P0, P1 and P2 all have higher death loss rates than the rest of the parities. All of these things do not even consider the performance of the offspring downstream. Research has shown that offspring of gilts grow slower, have more backfat and higher mortality than other parity offspring.
In next month’s column, we will take a look at some of the variation between farms and how disease has impacted some of the farms’ performance.
At Swine Management Services, our mission statement is to provide “Information solutions for the swine industry.” We feel with the creation of different SMS Benchmarking databases for all production areas we now have more detailed information to share with the swine industry. If you have questions or comments about these columns, or if you have a specific performance measurement that you would like us to write about, please contact Mark Rix, Ron Ketchem or Valerie Duttlinger. We enjoy being a part of the NHF Daily team.
Previous columns can be found at NationalHogFarmer.com.
About the Author(s)
You May Also Like
