Getting a Handle on Whole-Herd Feed Efficiency
Feed consumption per unit of live weight gain is the typical measure of feed conversion and so nutritionists tend to focus on factors that affect feed consumption and average daily gain. These factors include dietary energy, amino acid levels, feed availability, feed wasteage, etc. However, other factors also influence feed conversion, such as genetics, herd health and disease pressure, environment and management.
February 1, 2012
There are several ways to approach feed conversion measurement in a commercial setting. Vice President of Production Resources and Operations Aaron Gaines at The Maschhoffs in Carlyle, IL, shared his thoughts on the herd-management factors that influence whole-herd feed efficiency during the International Conference on Feed Efficiency in Omaha.
Acknowledging that “feed (consumption) per unit of live weight gain” is the typical measure of feed conversion, Gaines says nutritionists tend to focus on factors that affect feed consumption and average daily gain, such as dietary energy, amino acid levels, feed availability, feed wastage, etc. But other factors also influence feed conversion, such as genetics, herd health (disease), environment and management.
With the higher feed costs of recent years, producers and nutritionists are placing more emphasis on strategies to improve cost per unit of gain. Since 2007, as biofuel production took off and producers turned to high-fiber, low-energy diets, the inherent results were lower feed conversion rates and potentially lower carcass yields.
But Gaines wonders whether we are using the correct measure of efficient feed utilization.
“Typically, we measure feed per unit of gain on a live-weight basis, but most pigs are sold on a carcass basis — that’s what we’re getting paid for. This becomes particularly evident when we compare live vs. carcass gain measurements when high fiber diets are fed, and it affects carcass composition,” he notes. “Depending on which metric you use, live or carcass feed conversion, it will have a significant impact on the economic decisions made within a production system.”
To illustrate the point, Gaines shares data from a trial The Maschoffs conducted to determine the effect of distiller’s dried grains with solubles (DDGS) on feed efficiency. A standard corn-soy diet was compared to diets containing 15% or 30% DDGS (Table 1).
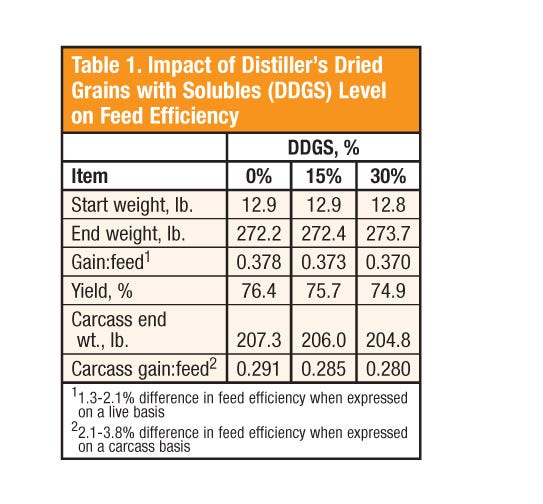
“Relative to the control diet, we lost from 1.3% to 2.1%, respectively, in feed conversion. However, when feed conversion was compared on a carcass basis, the reduction was 2.1% and 3.8%, respectively. This shows that the loss in feed conversion is greater when expressed on a carcass basis vs. live basis, the reason attributed to a significant reduction in carcass yield as we increased DDGS level,” he explains.
Moving Targets
At the outset, it’s difficult to compare traditional, pre-biofuel production measures with current results because the industry has adjusted to high feed costs by changing the dietary energy levels in many diets. Adding to the complexity is a trend toward older and heavier pigs at weaning, heavier market weights and changes in feed processing technologies such as pelleting, which makes it difficult to compare production records over time.
But there are some adjustment formulas that can help account for some of these changes and allow for better feed efficiency analysis. He offers three examples developed at Kansas State University:
Adjusted feed/gain = observed F/G + (50 – entry weight) x 0.005 +
(250 – marketing weight) x 0.005.
This equation standardizes for weight only — adjusting all groups to a common entry weight of 50 lb. and a market weight of 250 lb. “The multiplier (0.005) here is basically the slope of the equation describing live feed conversion rate (FCR) vs. body weight in a standard corn-soy diet with 5% added fat,” Gaines explains.
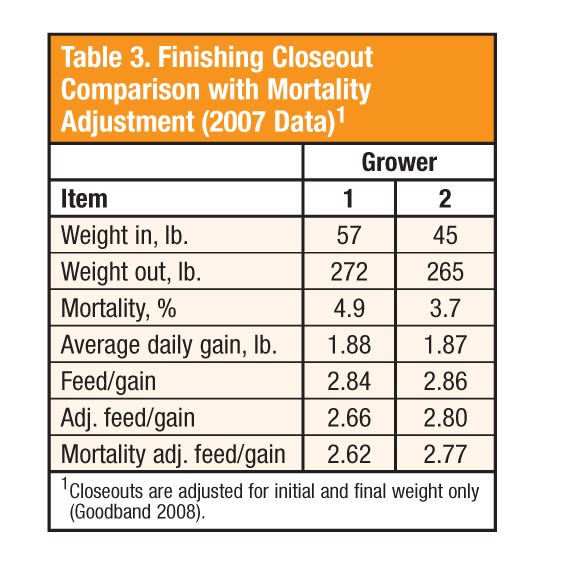
In Table 2, at first glance, one might think the feed conversion in Growers #1 and #2 are essentially the same (2.84 vs. 2.86). However, the adjusted data shows F/G in Grower #1 is 2.66 vs. 2.80 in Grower #2.
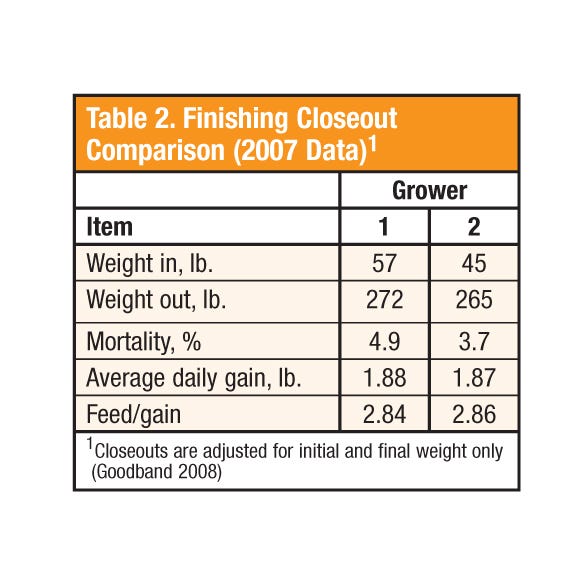
Grower #1 placed pigs that were heavier and were marketed at heavier weights. “This highlights the importance of body weight on feed conversion and the value of standardizing the closeout data,” he points out.
Taking the adjustments a step further, the following formula accounts for different grain sources, dietary energy levels and pelleted vs. meal diets:
Adjusted F/G = observed F/G + (50 – entry weight) x 0.005 + (250 – market weight) x 0.005 [Grain factor – (fat level x 2) x (1 – pelleted factor)].
This equation adjusts for energy levels for grain source and fat level. The grain factor is 1.00 for corn, 1.02 for milo, 1.18 for barley and 1.07 for wheat. In addition, the formula allows for a percent improvement in feed efficiency for pelleting, generally 4 to 6%.
“With this equation, you can start to standardize closeouts for energy level and whether the diets are pelleted or not,” he explains.
At The Maschhoffs, Gaines utilizes a modified approach when making adjustments to feed conversion in closeout records that accounts for weight and actual energy level fed. He plugs these standard weights and energy values into the Adjusted Feed Conversion Ratio (FCR) for finishing closeouts as follows:
Observed F/G = 3.00
Actual start weight = 45 lb.
Actual end weight = 250 lb.
Actual energy level = 1,500 kcal/lb. ME (metabolizable energy).
The formula:
Adjusted FCR = (Observed F/G + (Standardized start weight – Actual start weight) x Slope estimate + (Standardize live weight – Actual end weight) x Slope – ((Standardized energy level – Actual energy level)/Standardized energy level) x Observed F/G).
Therefore, the calculation is:
2.71 = (3.00 + (50 – 45) x 0.005 + (250 – 275) x 0.005 – ((1,600 – 1,500)/1600) x 3.00)
“You can use any standardized energy level. We typically standardize to a mid-level energy, somewhere around 3% supplemental fat, which prior to 2007 was what most of our trials were run at. That’s where we have the most research data, which was used to generate our feed conversion curves,” he explains.
“Again, it depends on how your pigs respond to dietary energy, so I encourage producers to understand how their pigs respond. In this case, I used a diet with no supplemental fat level, but at Kansas State, Bob Goodband provided about 1,600 kcal/lb. (ME), so when you standardize that closeout, you go from 3.00 actual FCR down to 2.71 standardized FCR.”
In an expansion of the equation, Gaines adjusts for the impact of pelleting, fineness of grind, mortality, etc.
Mortality Adjustments
From Gaines’ perspective, it is important to know how the nutritional program is working, so he not only standardizes FCR using data provided by the production staff, he also adjusts for mortalities.
“We’ve done this because, obviously, most systems experience shifts in mortality. For example, 3-4 years ago, prior to when the porcine circovirus vaccine was available, the introduction of a new disease impacted mortalities across the industry. To take some of the ‘noise’ out of closeout data and allow us to look at the nutritional or energetic component of feed conversion, we make adjustments for mortalities. But there are some dangers in doing that because it does not fully account for the disease’s impact on feed conversion or when the mortality occurred,” he continues.
“If you’ve got a disease that is causing a drag on feed conversion, it is not considered in this model. But if you are doing some mill comparisons or want to understand your nutritional program a little better and know whether you are making progress, perhaps there’s an argument for doing some adjustment — but you have to be careful with it,” he cautions.
The grower comparison in Table 3 shows the impact that mortalities can have on finishing closeouts. A slightly higher mortality in Grower 1 shaves four points off feed/gain when adjusted for mortality. The same adjustment in Grower 2 drops feed/gain by three points.
Gaines expects dietary energy levels in swine diets to continue to decline. “Most of the production folks probably think the nutritionists have gone mad because when they look at the (non-standardized) closeout data, feed conversion continues to go lower and lower,” he acknowledges. “Without making these adjustments, it really makes feed conversion data difficult to interpret.”
Shifting Our Thinking?
Gaines wonders whether the industry should shift to looking at caloric efficiency vs. feed-to-gain conversion, as it simply measures the amount of energy required per pound of gain. “The key point we need to know is the pigs’ response to dietary energy,” he emphasizes.
To further the discussion, the swine nutritionist offers several examples of how whole herd feed conversion may be presented — and the strengths and weaknesses of each.
Sow Herd Efficiency — The productivity of the sow herd directly affects the cost and the number of pigs the sows’ feed can be spread over.
“As we look at the whole herd feed efficiency metric, that’s typically done by measuring the amount of sow feed/pig marketed. It should include the feed associated with gilt development and, perhaps, the boar feed consumption. Again, this will be system dependent,” he says.
Sow farms generally measure feed efficiency based on sow feed/year or sow feed/weaned pig produced. Alternatively, you can measure sow feed/pound of weight produced, live or carcass. “If you go to a carcass weight-based system, obviously, we are not harvesting weaned pigs, but you can use a yield factor of 65 to 70% (of carcass weight) for a weaned pig to express the amount of sow feed per weight produced on a carcass basis,” he says.
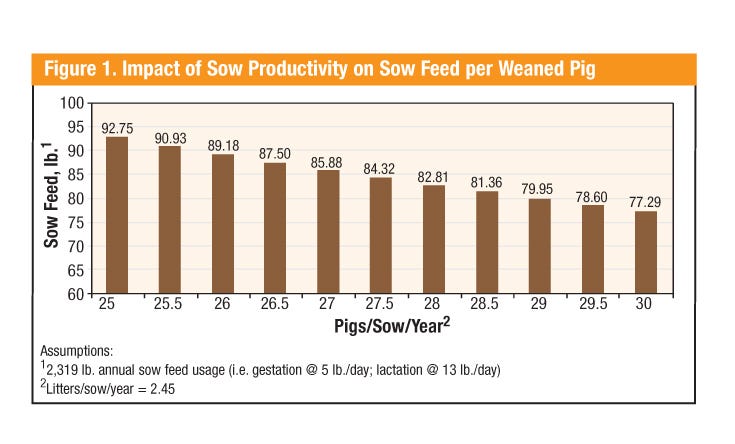
Figure 1 shows the impact of sow productivity on sow feed/weaned pig. A commonly used target is 80 lb. of sow feed/weaned pig. Assumptions include a sow would consume 2,319 lb. of feed annually (5 lb./day in gestation and 13 lb./day in lactation) and average 2.45 litters/year. “If you are going to hit that metric, you’re going to have to be pushing on 29 pigs/sow/year,” he points out.
Whole Herd Carcass Feed Efficiency — This metric includes gilt development feed, but not boar feed. The gilt development allotment is basically 335 lb./sow at a 50% replacement rate and assumes marketing at 198 lb., carcass weight basis.
“Basically, going from 25 p/s/y to 30 p/s/y, the whole-herd carcass feed conversion rate goes from 4.03 down to 3.96 — a little more than 1% improvement in whole-herd feed efficiency. That doesn’t seem like much, but as you look at sow feed as a total of the percent of feed used from farrowing to market, it’s only about 12%, so it gets diluted out pretty well,” he observes.
Energetic feed efficiency — When we think about herd management factors that affect feed efficiency, another measure is the pigs’ “energetic efficiency” potential in commercial production. To illustrate this metric, Gaines compared commercial vs. research herd measures of the cumulative carcass energy consumed/per pound of gain. “Basically, when you compare commercial vs. research, feed conversion is about 8% worse under commercial conditions compared to the research farm, so we do have some slippage in commercial practice.”
Accurate Data is Essential
As a discussion point, Gaines shares data from what he describes as “far from a cookie cutter system,” but he emphasizes the importance of data accuracy to their production people — particularly in terms of the pigs’ transfer weights as they move from the wean-to-feeder barn to the finishing barn.
“If you are a production guy and you decide to estimate the pig weight vs. actual pig weight (at placement into finishing), 5 lb. less than the actual weight is about six points in feed conversion from feeder pig to market weight,” he explains. “If you are off 10 lb., that skews feed conversion about 12 points. If you overestimate placement weights, it obviously goes the other direction. It’s a significant impact on feed conversion metrics if you are looking at feeder-to-finish closeout and you’re not using accurate data.”
Accuracy is equally important in determining the impact of reproductive output on feed conversion efficiency (Table 4). In this Australian study, Scenario 1 features a 1,000-sow farm with a replacement rate of 65%, 26% gilt matings, 82% farrowing rate, 11.3 pigs born alive/litter, 14% preweaning mortality, sow cull rate of 17%, and a culled sow weight of 385 lb. hot standard carcass weight. Scenario 2 has a 40% replacement rate, predictably fewer gilt matings (14%), an 85% farrowing rate, 11.5 pigs/litter (more multiparous sows), 12% preweaning mortality rate, an 8% sow culling rate, with a hot standard carcass weight of 462 lb.

“They modeled these two scenarios to show the impact of replacement rate on whole-herd feed conversion,” Gaines explains. Basically, to achieve the same number of pigs weaned under the two scenarios would require more sows to achieve the same number of weaned pigs.
Replacement rates are different because productivity levels differ. Because there are fewer offspring from gilts, there are more pigs marketed in Scenario 2. Sow cull market weights are higher in Scenario 1, due to higher replacement rate, but the progeny carcass weight is higher in Scenario 2.
“What is interesting is that whole-herd feed conversion is about 2% better when replacement rate is 40% vs. 65%,” he observes.
Gilt vs. Sow Progeny
The difference between the progeny of gilts vs. sows is generally accepted. This difference likely reflects differences of immunity at different production phases, Gaines explains. Citing another Australian study, preweaning mortality was 14.4% vs. 11.2% in progeny from gilts vs. sows. Similarly, those rates were 5.6% vs. 2.7% as weaners, 3.9% vs. 2.2% in the grower, and 6.7% vs. 4.8% in finishing, respectively.
Birth and Weaning Weights
One study showed light pigs (under 3 lb.) at birth had 3% lower feed conversion than heavier pigs (3.85 lb. or more), but weaning weights had little impact on the efficiency measure. This observation often leads to a discussion about how litter size affects birth weight and whether birth weight affects feed conversion.
“From the data, as you go from 13.2 pigs/sow/year (p/s/y) to 30.9 p/s/y, there is a drop in birth weight. The take-home message is it is important to check with your genetic supplier to make sure they have birth weight plugged into their selection index. If they don’t, it could have a negative impact on feed efficiency,” Gaines says.
Mortality, Harvest Weight
The old adage is if you are going to lose pigs, lose them early before they eat much feed. As a rule of thumb, Gaines says if you lose a pig at 115 lb., the loss knocks about 0.5 points off feed conversion. At 225 lb., the loss is close to two points.
Clearly, as market weights get heavier, feed conversion gets worse. “Depending on your marketing plan and your marketing agreements, you have to consider the impact market weights have on feed efficiency in terms of determining the optimum market weight,” he points out.
“Take Home” Checkpoints
There are strong arguments that feed efficiency should be expressed on a carcass vs. live weight basis.
· To improve system-level interpretation and analysis of feed conversion data, Gaines suggests adjusting for body weight, energy levels in diets, pelleting and mortality.
· Production scientists and swine nutritionists should consider using caloric efficiency as their measure of feed efficiency.
· The productivity of the sow herd should be considered when measuring feed efficiency.
· Sow replacement rate does affect whole-herd feed efficiency because sow parity, including the proportion of Parity 1 females, affects this measure.
· Mortality has a significant impact on feed efficiency, particularly when pigs are lost in late finishing.
· Birth weight has a significant impact on feed conversion and should be considered as producers aim for higher p/s/y.
· Harvest weight and removal strategy will influence feed conversion.
· More floor space, particularly in the early nursery stage, appears to have a positive impact on feed conversion, but generally does not affect feed conversion in later stages of production.
Out-of-feed events have no apparent impact on feed conversion basis published data.
You May Also Like


