Drought Increases in Midwest, South
September 13, 2013

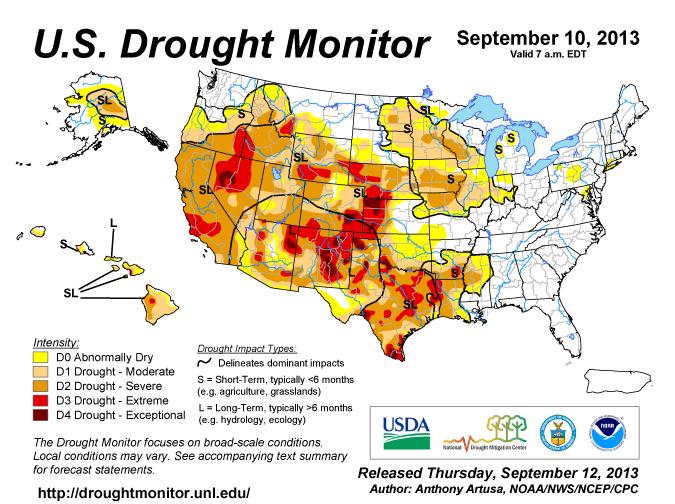
Hot, dry weather in the Midwest and South led to incremental increases in drought on the Sept. 10 U.S. Drought Monitor map.
The proportion of the contiguous United States in moderate drought or worse increased to 50.69%, from 50.09% a week earlier. The areas in severe and extreme drought had similar small increases, and exceptional drought remained unchanged. More than three-quarters of the western United States remains in moderate drought or worse.
In the Midwest, where temperatures were as much as 10 degrees Fahrenheit above normal, drought expanded in parts of Missouri, Iowa, Illinois, Indiana, Minnesota and Wisconsin. This week’s U.S. Drought Monitor author, Anthony Artusa, said in narrative accompanying the map that since July 1, La Crosse, WI, has received only 2.4 in. of rain, the driest July 1-Sept. 10 period on record for that location. The previous record was 2.52 in. in 1948.
Farther south, drought expanded or intensified in areas of Louisiana, Arkansas and Mississippi. Drought also got worse in southeastern Nebraska, northern Texas, Hawaii and Oklahoma. Artusa said that in Jackson County, OK, Lake Altus-Lugert dropped to a historic low of 12.6% of capacity.
Like what you’re reading? Subscribe to the National Hog Farmer Weekly Wrap Up newsletter and get the latest news delivered right to your inbox every week!
Drought conditions improved in northeast Nebraska, far south Texas, central Arizona, and parts of Colorado and Wyoming.
U.S. Drought Monitor authors synthesize many drought indicators into a single map that identifies areas of the country that are abnormally dry (D0), in moderate drought (D1), in severe drought (D2), extreme drought (D3) and exceptional drought (D4). The map is released each Thursday based on data through the previous Tuesday morning.
The U.S. Drought Monitor map is jointly produced by the National Drought Mitigation Center at the University of Nebraska-Lincoln, the National Oceanic and Atmospheric Administration, the USDA, and about 350 drought observers across the country. Artusa is with NOAA’s Climate Prediction Center.
Statistics for the percent area in each category of drought are automatically added to the U.S. Drought Monitor website each week for the entire country and Puerto Rico, for the 48 contiguous states, for each climate region, and for individual states. U.S. Drought Monitor data online goes back to January 2000.
http//drought.unl.edu/MonitoringTools/USDroughtMonitor/DroughtMonitorTips.aspx
U.S. Drought Monitor map, statistics and narrative summary: http://droughtmonitor.unl.edu
You might also like:
Pork Repeats Strong Demand Showing
Analyzing How Farm Size Impacts Piglet Survival
You May Also Like


