Does phytase release less phosphorus than we think?
Are we feeding enough phosphorus to developing gilts?
July 7, 2020
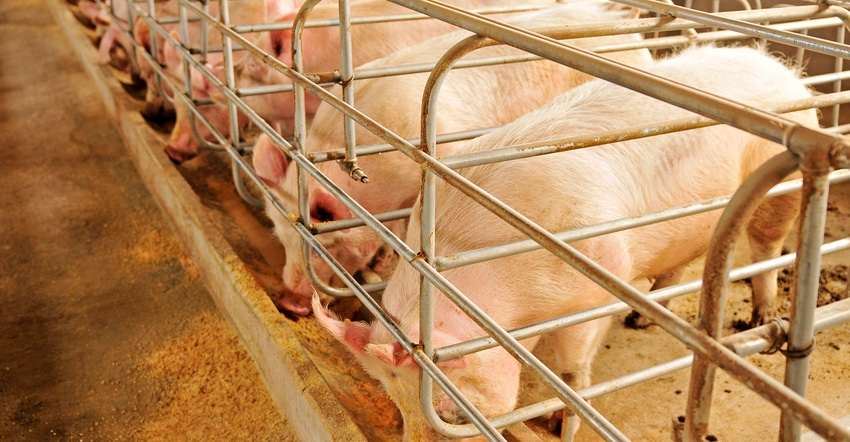
Phytase has become a "staple" in many swine diets. We know that it releases phosphorus bound to phytate in the diet, allowing the pig to absorb and utilize more of that phosphorus. Some nutritionists even give phytase credit for energy, calcium and amino acid contributions due to evidence that it can release these nutrients in addition to phosphorus.
When formulating diets using phytase, it is important to know how much phosphorus is being released by phytase in order to appropriately adjust other ingredients in the diet (monocalcium phosphate, for example), and meet the pig's need for phosphorus while optimizing feed cost. In this article we would like to explain why it may be necessary to question whether current phosphorus release values for phytase may be overestimated.
Some data indicate phytase may not release quite at much phosphorus as we think, due to limitations in the research methods that are used to determine phytase release values. Traditionally, P release values for phytases are developed using dose-response curves, which require the feeding of diets that are well below the pig's requirement for P. This enables growth performance and/or bone mineralization to be used to define the phytase P release value.
However, we know that when pigs are fed diets deficient in P or other minerals, the intestinal tract will basically absorb "extra" of the deficient mineral to try to compensate for the deficiency. This may mean that experiments using P-deficient diets to evaluate phytase do not accurately represent the action of phytase, and therefore P release, under the normal physiological conditions of commercial pig production, i.e. when diets are not deficient in P.
In a recent experiment conducted at Iowa State University, we tested three levels of phytase (Ronozyme HiPhos 2500GT, DSM Nutritional Products Inc.), when added to either a P-deficient or a P-adequate control diet. Seventy-two growing pigs (starting body weight approximately 50 pounds) received one of eight corn-soybean-meal based dietary treatments; a P-adequate diet with 0, 350, 600 or 1,000 FYT phytase per kilogram, or a P-deficient diet with 0, 350, 600 or 1,000 FYT phytase per kilogram. The P-deficient diet had a standardized total tract digestibility P level of 0.18%, and the P-adequate diet had an STTD P level of 0.36% (the requirement according to National Research Council 2012 is 0.31%). These diets were fed for 25 days followed by a five-day fecal and urine collection period to measure P and calcium digestibility and metabolism.
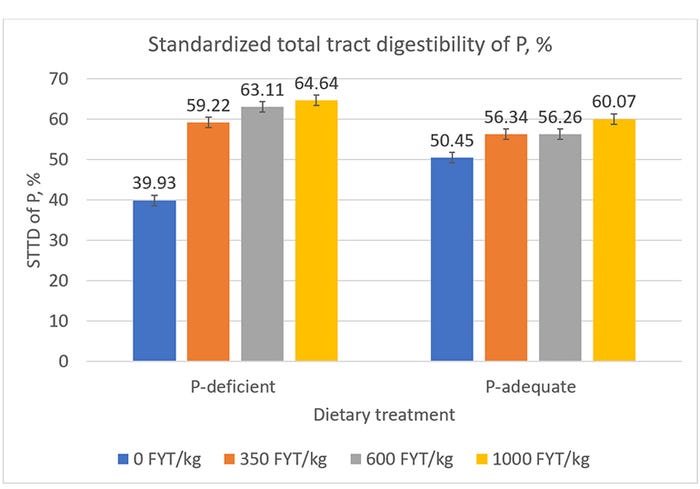
Using calculations on the basis of STTD, P digestibility was improved in both P-adequate and P-deficient diets, but the improvement was much smaller when phytase was added to the P-adequate diets. When 350 FTY per kilogram was added to the P-adequate diet, there was about a 12% increase in the STTD of P, whereas this level of phytase yielded a 48% increase in digestibility when added to the P-deficient diet. Although the response to phytase was quadratic in the P-deficient diets, 1,000 FYT per kilogram still released 0.04% more STTD P than in the P-adequate diets.
This result agrees with findings from a similar previous study we conducted using a different phytase, where the improvement in STTD P from phytase was also smaller in a P-adequate diet than a P-deficient diet (Olsen et al., 2018). Calcium digestibility was improved by phytase in the P-deficient diets, but not in the P-adequate diets. We also saw slight improvements in digestibility of dry matter, gross energy and crude protein with phytase, but this was not dependent on dietary phosphorus level.
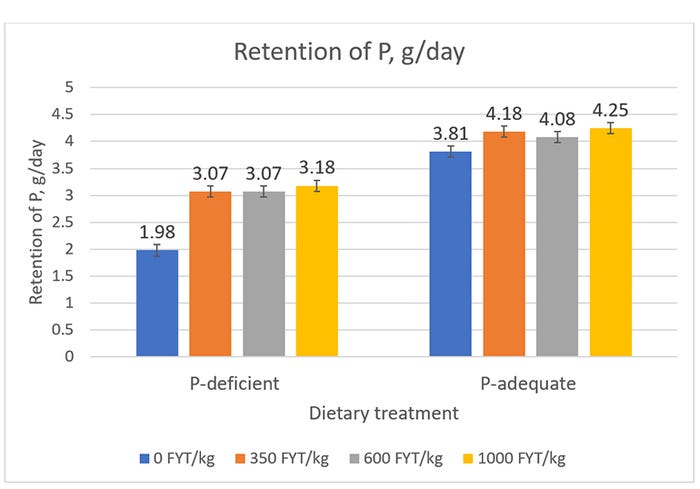
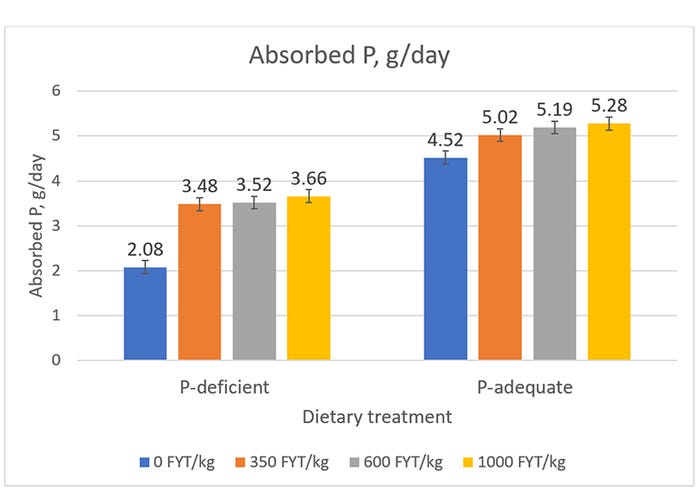
Because we measured individual daily mineral intake and output in feces and urine, we were able to measure both P and Ca balance. In our previous study (Olsen et al., 2018), we observed that growing pigs were able to continue retaining P in the body well after their expected requirement for P was met (based on the NRC 2012 requirement for growth). This led us to question whether we may be underfeeding P to developing gilts, considering that bone development is crucial for longevity in a sow herd.
In the current experiment, we observed a slight increase in P retention when phytase was added to the P adequate diets, but neither absorption nor retention of P reached as high of a level as in the previous experiment. We believe this may have significant implications for developing gilts; if phytase is releasing less P than we think and if we are feeding less P than what is optimal for bone development, the combination of these two issues could lead to longer-term problems with bone development and sow longevity.
Considering that lameness remains one of the most prevalent reasons for sows to leave a herd (Ross et al. 2018), we believe this is an area that needs further evaluation and careful consideration when formulating diets and utilizing phytase in diets for developing gilts.
Phosphorus release values for phytase that are developed when diets are deficient in P should be validated in commercially-relevant diets that are not deficient in P. This will improve our ability to formulate diets with confidence that requirements for P are being met. Also, the optimal amount of digestible phosphorus and phytase in diets for developing gilts may warrant further investigation in order to optimize bone development for sow longevity.
Sources: Kristin Olsen and John Patience, who are solely responsible for the information provided, and wholly own the information. Informa Business Media and all its subsidiaries are not responsible for any of the content contained in this information asset.
You May Also Like
