Why is wean-to-service interval critical to your farm?
If your days for weaned sows to cycle are over six days, you need to evaluate what is causing this to happen and make the changes needed to lower cycle days.
This month we are looking at the effect of wean-to-service interval on several areas of production. In 2013 when we last looked at this topic, the farms in the top 10% of the database were averaging 5.47 days. Today that number is 5.25. The bottom 25% in 2013 was at 7.65 days. Now we are looking at the bottom 30% averaging 8.89 days. The top 10% have improved while the bottom has gotten worse over the last three-plus years.
In Chart 1 we look at the entire SMS database with over 1.7 million sows and for the last 52 weeks to compare wean-to-first-service interval to farrowing rate. The chart is set up with lowest wean-to-first-service days farms on the left side. Sorted by wean-to-first-service interval (blue line), the farrowing rate represented by the red dots for each farm. The black line is the trend line for farrowing rate indicating that the higher the wean-to-first-service interval is the lower the farrowing rate for the farm is. We would consider wean-to-first-service to be a driver to improving production numbers.
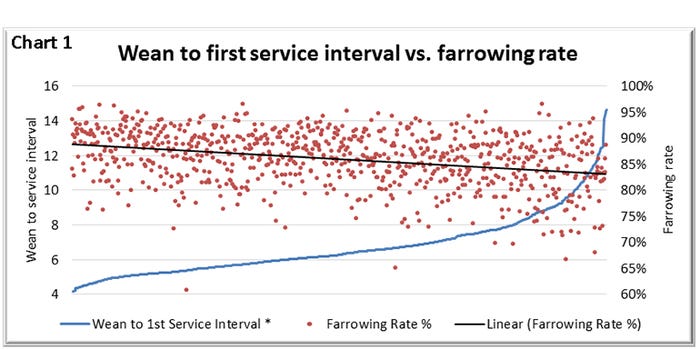
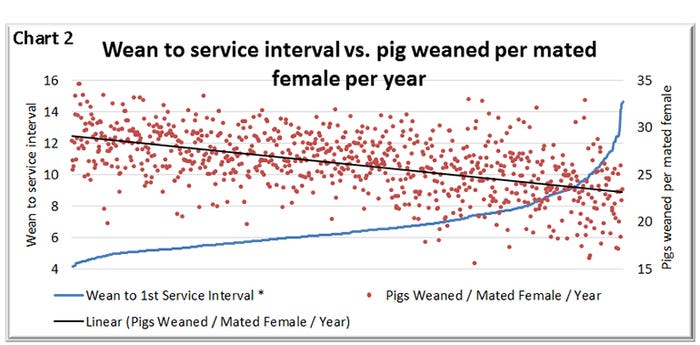
Chart 2 shows a similar picture, but instead of looking at farrowing rate it looks at pigs weaned per mated female per year. The trend line shows again that the higher the wean-to-service interval the lower the pigs weaned per mated female per year is.
Wanting to look at this on a more individual basis we looked at a subset of data that included 388,000 matings across 36 different farms. Chart 3 shows the farrowing rate by wean-to-service interval on those matings as well as the percent bred at each interval. This data set shows that 41.9% of weaned sows are getting their first dose of semen on Day 4 now. Also look at the declining farrowing rate for weaned sows bred Day 6, 7-9 and 10-22 days after weaning. This is typical for a lot of farms. Some farms are considering whether to breed these sows, let cycle or just cull. It indicates that sows bred Day 64-plus have the lowest farrowing rate. Our question is why is the farm keeping non-cycling sows that long?
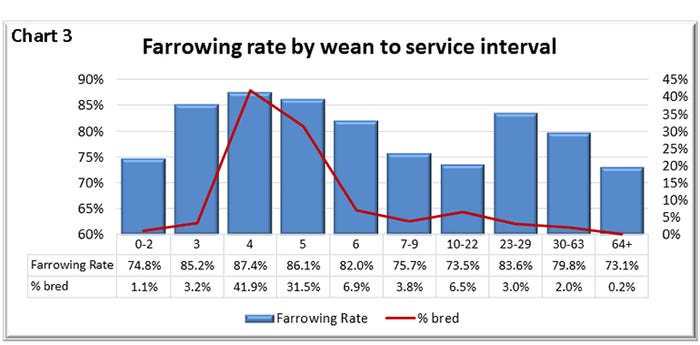
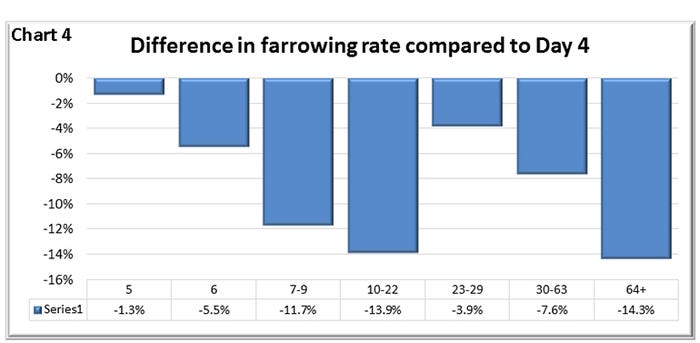
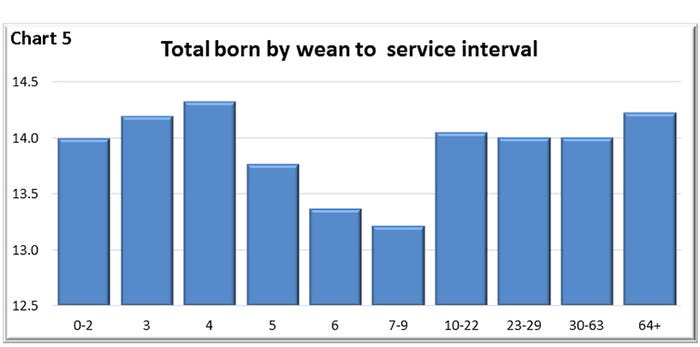
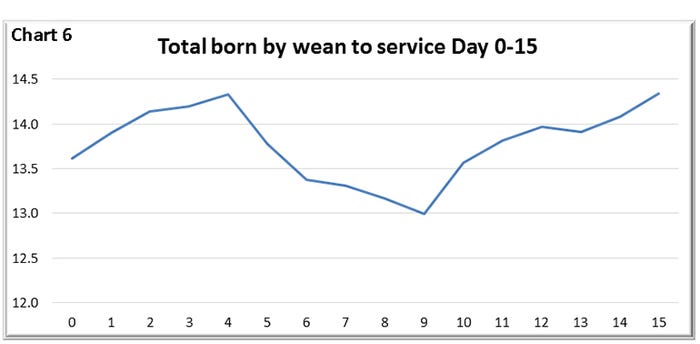
Chart 4 takes a look at the same information but in a different way: what is the difference in farrowing rate compared to Day 4 which is the highest. Chart 5 looks at total born by wean-to-service interval group. As we have seen the shift to more weaned sows being bred Days 3-5 which have the higher farrowing rate there are also more total pigs being more to these sows. This chart also shows that the lowest total born is in sows bred Day 7-9. Also looking at an increase in total born for weaned sows bred Days 10-plus days after weaning. Our thoughts for a lot of these sows is they were missed in heat before Day 10 and it allowed to skip heat, these farms should be having more total born pigs. However, when you look at the individual days for Day 0-16 in Chart 6, it shows that it takes to Day 14 to get back to a 14 total born.
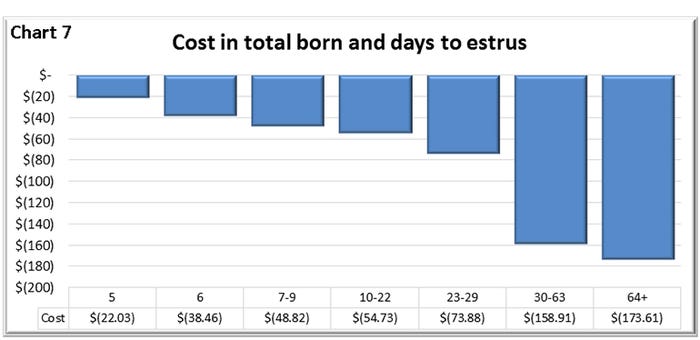
In Chart 7 we look at the costs of wean-to-service interval compared to those that are being bred on Day 4. We again used the costs of nonproductive days of $2.50 per day. We assumed that total born would transfer to the same change in number weaned and used the value of $35 per weaned pig. The chart shows that a sow bred Day 10-22 costs a unit $54.73 compared to those bred Day 4. Those bred at 30-63 days jumps to $158.91 with an average of 59 days for the dataset.
There are several things that drive the variation across the industry in wean-to-service interval. Genetics is still a factor although it is much less of a factor than it has been in the past. Major disease breaks are another driver. The third factor that producers can overcome more easily is nutrition. The units that are using more aggressive or ad libitum feeding starting the day sows farrow are the ones with the lowest wean-to-service intervals. Sow body condition also plays a big role in achieving maximum intake in lactation.
There has also been widespread success in either providing extra feed to sows from weaning until mating or providing lactation feed during that time period, this plays a bigger role in the total born. We see that P1 females are challenged the most in farrowing. There are now more farms going back to feeding these specific females a more dense higher energy diet in farrowing to compensate for the lower daily feed intake.
Exposing sows to mature boars daily starting on the day of weaning is also important in reducing the wean-to-service interval. This doesn’t mean that a boar can just walk by them and be “exposed.” This takes time and an active boar, a boar that is frothing.
Most farms are now beginning estrus detection and boar exposure on weaned sows starting on weaning day but there are those that are not and are likely missing some sows in heat Day 1 coming out of the farrowing area. In the subset of data used in this column 4.2% of the sows were bred Day 0-3 while another 42% were bred Day 4. Sows that are nurse sows, split weaned or lost a pig late in lactation are likely to start cycling before being weaned.
If your days for weaned sows to cycle are over six days, you need to evaluate what is causing this to happen and make the changes needed to lower cycle days. As you see, farrowing rate and total born are driven by that number.
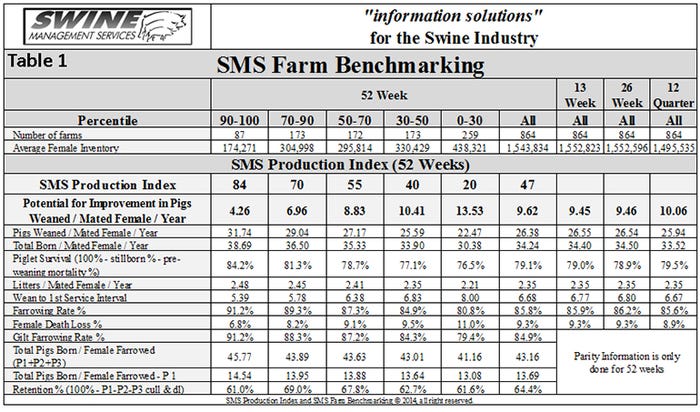
Table 1 provides the 52-week rolling averages for 11 production numbers represented in the Swine Management Services Production Index. The numbers are separated by 90-100%, the 70-90%, the 50-70%, the 30-50% and the 0-30% groups. We also included the 13-week, 26-week and 12-quarter averages. These numbers represent what we feel are the key production numbers to look at to evaluate the farm’s performance.
At SMS, our mission statement is to provide “Information solutions for the swine industry.” We feel with the creation of different SMS Benchmarking databases for all production areas we now have more detailed information to share with the swine industry. If your farm would like to be part of the SMS Benchmarking databases, or if you have suggestions on production areas to write columns about, contact Mark Rix, Ron Ketchem or Valerie Duttlinger. We enjoy being a part of the NHF Daily team. Previous columns can be found at NationalHogFarmer.com.
About the Author(s)
You May Also Like

