What is the value of your closeout data?
Hog producers spend more and more time collecting data, but the real value of collecting the data comes in analyzing the data and making decisions that are sound based on what the data says.
February 28, 2017
By Ron Ketchem, Mark Rix and Valerie Duttlinger, Swine Management Services LLC, Fremont, Neb.
At Swine Management Services, we have a saying “pigs tell all.” The question is, are you listening?
Producers spend more and more time collecting data, but the real value of collecting the data comes in analyzing the data and making decisions that are sound based on what the data says. This is the tough part for most producers for several reasons. In order to make sound decisions on closeouts the data needs to be accurate and it needs to be standardized so that the comparisons truly have value.
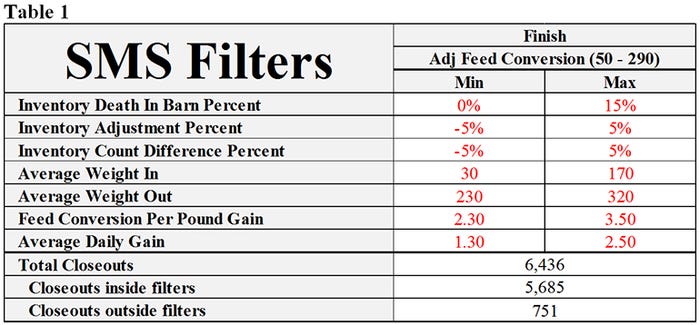
SMS created a filtering system for removing data that is either too good or too bad from the benchmarking. In Table 1 are the ranges for the filters SMS uses. These filters can be changed, but normally we leave them with a wide range. The number of closeouts that are filtered out was 12% for the last updated the benchmarking.
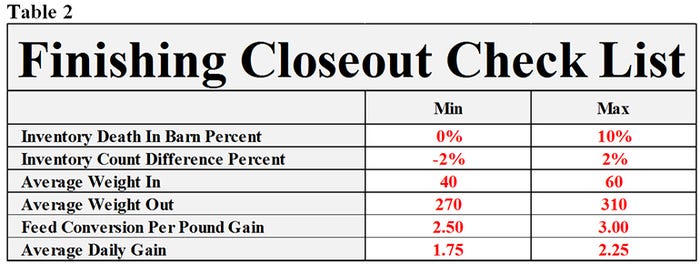
Every producer should have a check list with the range numbers like the one in Table 2 for the data entry staff to compare every closeout against and any closeouts that are outside of the range need to be check for accuracy. From the closeout data we get, most producers are not checking their closeouts. A lot of the time it was that two ton of feed that would not fit in the right bin at the farm and was placed in to another one which is a different group of pigs. Did anyone tell the office? Also, could market pigs be sent to market from another group to fill out the truck? Then sale weights, number of pigs and value appear in a different closeout. If you run reports and look at averages they are probably right, but the problem is the accuracy of individual closeouts.
At SMS, we have created an SMS Production Index to rank closeouts for easier diagnosis and comparison. We use death loss and dead on arrivals, culls and lights, average daily gain and adjusted feed conversion. Every closeout gets a rank of zero to 100 based on the percentile rank in the four categories.
SMS has developed a model to compare all closeouts to and standardize input cost and market prices so that closeouts can be compared over time without feed cost and market prices skewing the data. We recalculate all the closeouts against the SMS model. When we look at the opportunity dollars per pig we use the Top 25% as the base to compare to. The last run of the database showed an average closeout have a $12.17 opportunity dollars per pig compared to the top 25% and the bottom 25% have a $24.11 opportunity dollars per pig which can be seen in Table 3.
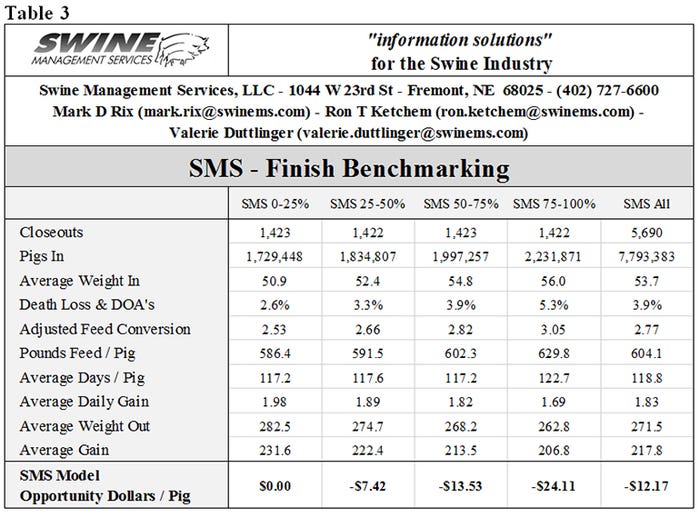
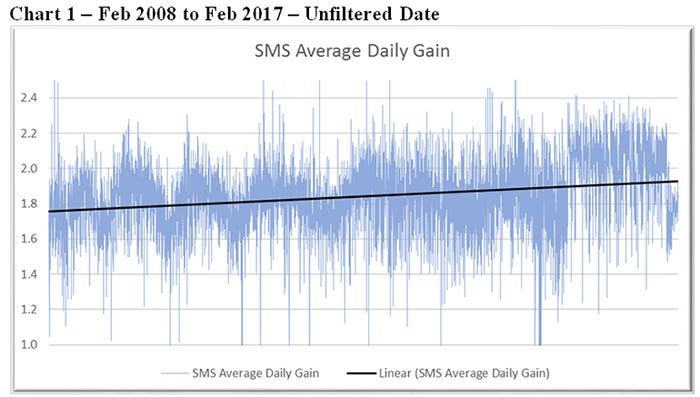
The average daily gain, Table 3, is 1.83 for all the closeouts and Chart 1 is unfiltered closeouts has trend line shows a nice improvement over the eight years, but the variation is tremendous. Chart 1 shows ADG from 1.0 to 2.45. The top 25% of the closeouts average daily gain is 1.98 and the bottom 25% of the closeouts are 1.69.
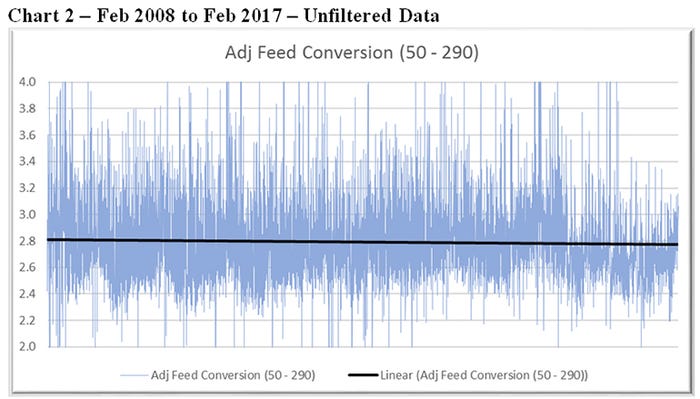
The adjusted feed conversion, Table 3, is 2.77 with a flat trend line over the eight years, but again the variation is tremendous. Chart 2 is unfiltered adjusted feed conversions closeouts with some as low at 2.0 to a high of 4.0 pound of feed per pound of gain. The top 25% of the closeout adjusted feed conversion is 2.53 and the bottom 25% of the closeouts are 3.05.
It takes time to evaluate the data, to make sure it is accurate data, to compare it to past history, to compare it to the industry, and most importantly to learn from it and determine what can be done to get better performance in the future. Are you spending the time it takes to get the value out of your closeout data?
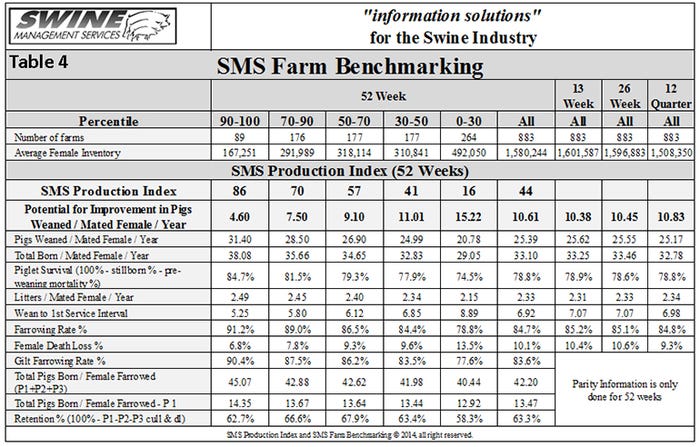
Table 4 provides the 52-week rolling averages for 11 production numbers represented in the SMS Production Index. The numbers are separated by 90-100%, the 70-90%, the 50-70%, the 30-50% and the 0-30% groups. We also included the 13-week, 26-week and 12-quarter averages. These numbers represent what we feel are the key production numbers to look at to evaluate the farm’s performance.
At SMS, our mission statement is to provide “Information solutions for the swine industry.” We feel with the creation of different SMS Benchmarking databases for all production areas we now have more detailed information to share with the swine industry.
If you have questions or comments about these columns, or if you have a specific performance measurement that you would like us to write about, please contact: [email protected], [email protected] or [email protected]. We enjoy being a part of the National Hog Farmer Weekly Preview team. Previous Production Preview columns can be found at NationalHogFarmer.com.
You May Also Like
