What do we know about gestation length?
Does your farm know what your true gestation length average is and the range? You probably need to know if you are doing any inducing of sows.
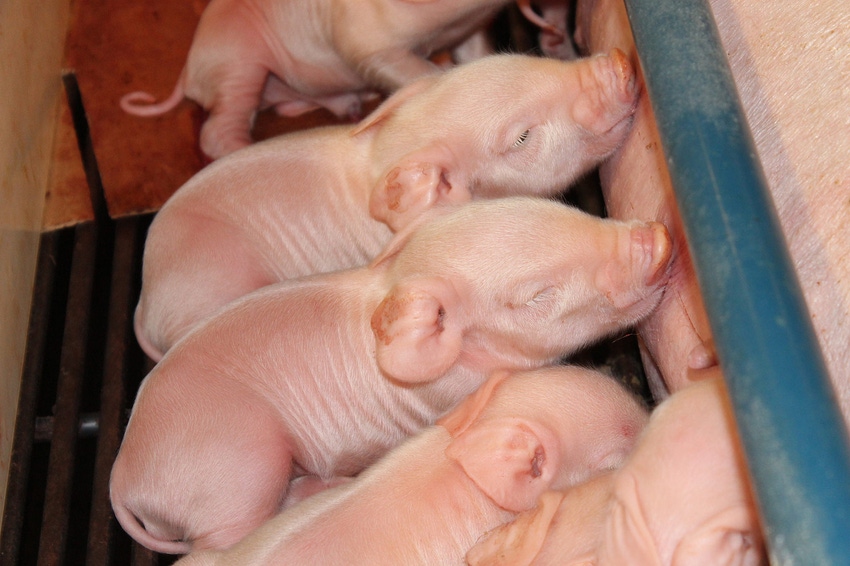
This month we wanted to take a look at gestation length for a couple of reasons. The first being as a follow-up from last month’s column that showed stillborns are higher when sows have a shorter gestation length as well as those at 120-plus days.
The second reason is working with producers over the last month and gestation length has become a topic of discussion and debate as to inducing. What are the advantages of inducing and attending farrowings compared to letting the sows go on their own when they are ready?
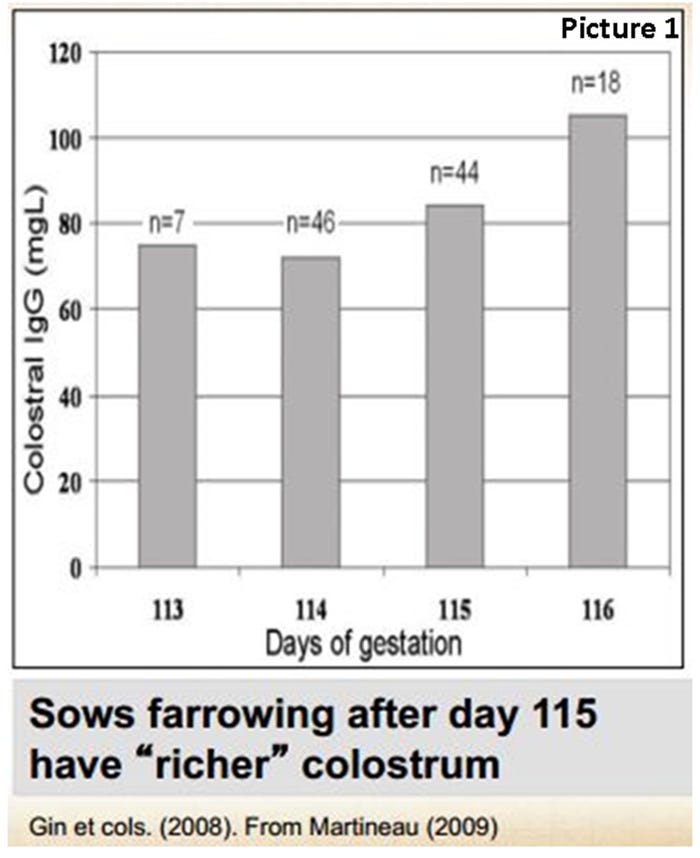
Over the last several years natural gestation length has risen as the number of total born piglets has risen. However, management practices haven’t changed with some farms still inducing to farrow on day 114 or even day 115. Some of the things we see when inducing too early besides smaller pigs at birth are an increase in low viable pigs and more sows that do not come to milk and have to be replaced early in lactation. Pigs that are weaker at birth don’t get started as well and some farms even see higher incidence of hard udders because the pigs are not nursing enough to prevent it. Picture 1 shows that sows farrowings after day 115 have “richer” colostrum” (Gin et cols. [2008]), and we know how vital colostrum is to the survival of the pigs.
For this column, we chose 34 farms that are part of the SMS Analysis Program and looked at 560,875 farrowings. Within the dataset there are farms that are inducing up to 90% of the sows and farms that aren’t inducing at all. In 2013, the average gestation length for the farms was 114.9 days, and in 2016 it was 115.6 days and 2017 year-to-date is 115.8. Total born ranged from 12.87 to 15.95 for the three-plus year period of time with 14.02 pigs as the average.
Chart 1 looks at the number of first service females (no repeats) and the gestation length based on how many doses of semen they received. The data showed that 8.6% of matings were single matings and 24.8% of females were mated three or more times. Chart 2 looks at the percentage that farrowed each day based on number of doses. The take-home message from these two charts is that sows getting three doses of semen have longer gestation lengths. However, it isn’t the number of doses that is important, it is making sure that each sow is treated as an individual and mated with the number of doses that she needs.
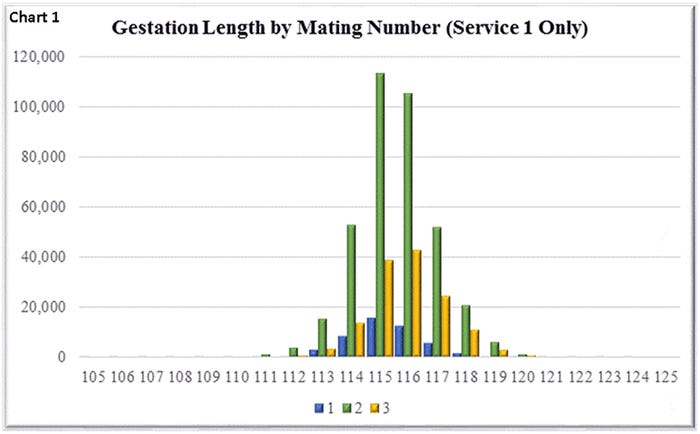
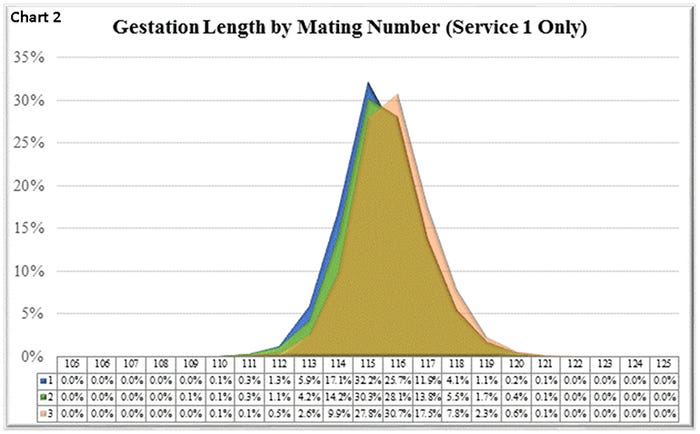
Chart 3 looks at the 34 farms and their average gestation length which range from 114.1 days to 117.3 days. The right axis is for number of pigs, the solid black line looks at total born while the dashed line is for live born. Chart 4 looks at the same farms, and looks at the number of stillborns by farm in comparison to gestation length. The take-home message from this chart is that there is huge variability from farm to farm on the number of stillborns per litter regardless of the gestation length of the farm.
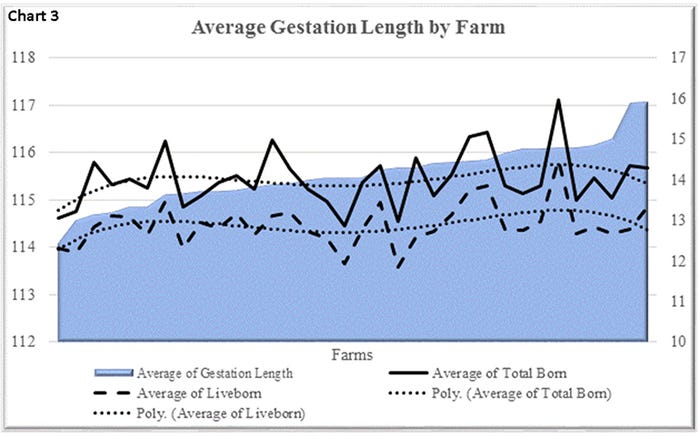
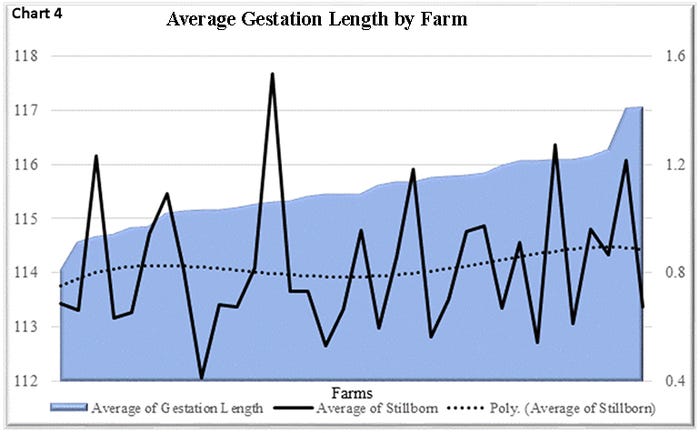
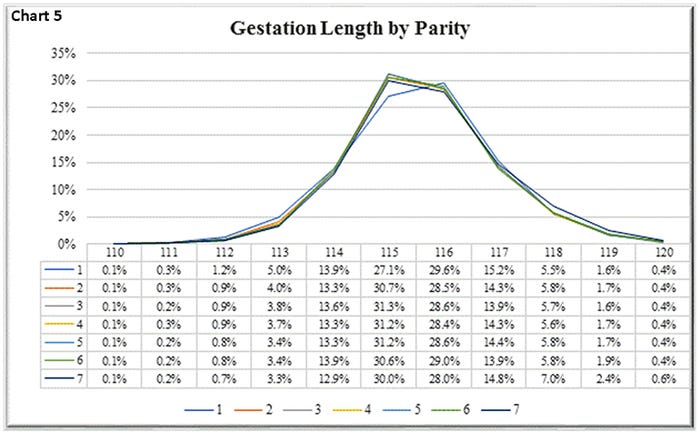
Chart 5 looks at gestation length by parity and all parities overlay each other except for P1s. This is in large part to letting gilts go on their own more often rather than inducing them or at least letting them go a day longer than sows if inducing everyone. This data shows that 92.3% of the sows are farrowing Day 114 to 118 and the range is from 105 to 125 days. Not all programs will accept a farrowing at 105 days and some even not prior to 110 days.
From a management perspective, here are some things to consider.
• What is the natural gestation length of the genetic line in your herd? If you don’t know, check with your genetic supplier.
• Your farm should use induction selectively to finish out a farrowing room usually with Day 116 and up.
• If your farm induces problem sows that have a history of high stillborns or large litter size, make sure someone is attending them while they are farrowing to help reduce stillborns and save more pigs.
• When are you recording the farrowing date? Some farms record once a day and anyone finished at that point was “born” that day. What about the sow that finished an hour after you record them?
Does your farm know what your true gestation length average is and the range? You probably need to know if you are doing any inducing of sows.
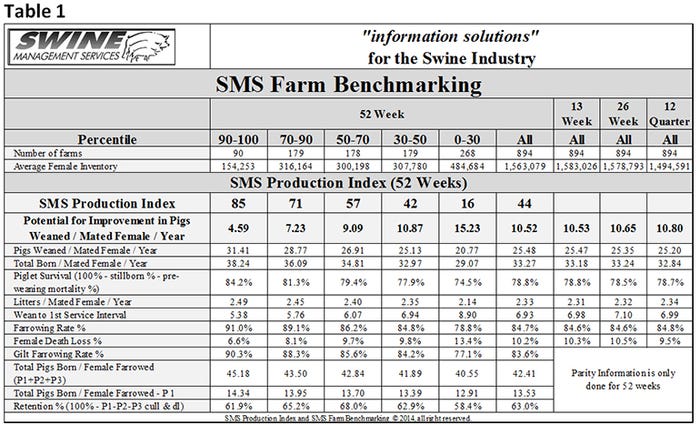
Table 1 provides the 52-week rolling averages for 11 production numbers represented in the SMS Production Index. The numbers are separated by 90-100%, the 70-90%, the 50-70%, the 30-50%, and the 0-30% groups. We also included the 13-week, 26-week and 12-quarter averages. These numbers represent what we feel are the key production numbers to look at to evaluate the farm’s performance.
At SMS, our mission statement is to provide “Information Solutions” for the swine industry. We feel with the SMS Sow Farm Benchmarking, the SMS Growing Pig Benchmarking and the SMS Carcass Evaluation Program we cover all areas of production. We now have more detailed information to share with the swine industry. If your farm would like to be part of the SMS Benchmarking programs, or if you have suggestions on production areas to write columns about, please email us at [email protected], [email protected] or [email protected]. We enjoy being a part of the National Hog Farmer “NHF Daily” team. Previous Production Preview columns can be found at NationalHogFarmer.com.
About the Author(s)
You May Also Like


