Monitoring changes in breeding herd productivity
Statistical process control tools can easily be implemented in swine herds to track key productivity parameters with intent to detect signals potentially associated with disease introduction
February 8, 2017
By Gustavo Silva and Daniel Linhares, Veterinary Diagnostic and Production Animal Medicine, Iowa State University College of Veterinary Medicine
The economic impact of infectious diseases is, in great part, due to changes in productivity. Therefore, systematically monitoring key production indicators (KPIs) allows 1) detecting economically important disease outbreaks, 2) quantifying the duration and magnitude of disease-attributed impact on whole-herd productivity and 3) measuring the effect of selected health interventions to treat/control diseases.
Statistical process control (SPC) tools have been developed to allow systematically monitoring of parameters of interest. There are several SPC methods available including Shewhart, cumulative sums (CUSUM) and exponentially moving weighted average (EWMA).
The purpose of this column is to describe the implementation and the benefit of such methods in the swine industry.
Methods
Define outcome: The first step is to define which parameter(s) to monitor. Following “number of weaned pigs per week” allows throughput analysis which is easily translated to economic value to producers.
Define baseline: The second step is to define what the “baseline” (reference) level is for the parameter of interest. We recommend using a period of 21 weeks (=breeding herd production cycle) of “peace time,” that is, period of no disease outbreak or other significant event that drove changes in the parameter of interest.
Use SPC methods to detect changes in productivity: Using Microsoft Excel add-ins or other software packages (e.g. R-project or SAS), SPC tools such as EWMA detect significant changes from the baseline. Significant changes are called “signals,” which may be associated with disease outbreaks. Diagnostic testing is recommended to confirm (or rule out) specific diseases. The duration and magnitude of those signals can be measured (i.e. cumulative deficit of volume of pigs weaned per week), which is very informative to quantify the total loss attributed to a disease outbreak or to compare effectiveness of health intervention options (between different herds).
Results
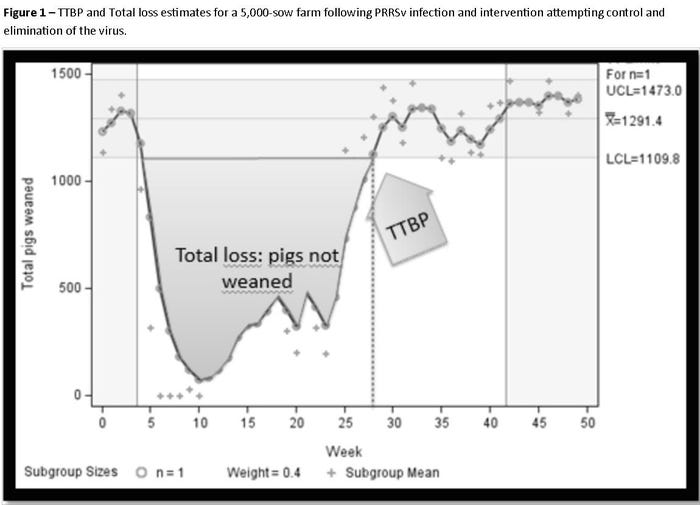
To illustrate the method, we used the example of a 5,000-sow farm that became infected with porcine reproductive and respiratory syndrome virus (week 0) and adopted “load-close-expose” as intervention to attempt elimination of PRRSv (week 4). The signal (change in number of pigs weaned per week) was detected at week 4 (when the sow farm was exposed to live PPRS virus) and the duration of the signal was of 28 weeks. In other words, it took 28 weeks for the herd to recover the level of weaned pig productivity that the farm had before the PRRS break. Thus, the time to baseline productivity (TTBP) was 28 weeks. The deficit of number of pigs (not weaned) was 21,481 pigs not weaned (or 4.3 pigs not weaned per 1,000 sows) (Figure 1). The baseline productivity had an average of 1,291 pigs per week, with upper and lower control limits of 1,473 and 1,110, respectively.
Those numbers allow making adjusted comparison of “total loss” between farms of different characteristics and/or using different disease management solutions/protocols.
Discussion and conclusion
SPC tools can easily be implemented in swine herds to track key productivity parameters with intent to detect signals potentially associated with disease introduction. Once disease has been confirmed with diagnostic testing, SPC methods can consistently calculate time to baseline productivity and “total loss” estimates. These estimates are useful to quantify the impact of diseases on production and/or to measure the impact of health interventions on pig farm productivity.
The SPC methods can be easily replicated using Excel, SAS or other statistic software package (Montgomery, 2012). This approach can also be used for the wean-to-finish phase of production, changing outcome to “number of pigs marketed” or “opportunity cost of production.”
Acknowledgements
We thank Robert (Bob) Morrison [University of Minnesota] for significant contribution on optimization of SPC tools for the swine industry.
References
Krieter J, et al. 2009. Liv Sci. 121 (2-3):281-287.
Montgomery D 2012. 7th ed. John Wiley & Sons.
Neumann EJ, et al. 2005. JAVMA 227 (3):385-392.
You May Also Like
