Forgotten loss: Marketing transportation
Numerous people are involved in getting a pig to market from birth, do not let frustrations or sloppiness end up losing that pig when so close to finish line.
February 1, 2023
Have you ever worked so hard for something by pouring your hard sweat, tears and money only to lose at the end? In 2015 at PAC 12 track meet, senior runner for the Oregon Ducks named Tanguy Pepiot, came around the final corner, well ahead of the other racers, when he started to celebrate his premature victory. Unfortunately for him, he was passed by a runner from the Washington Huskies to lose the race in an embarrassing way. The lesson to be learned is to finish what you started and not lose focus on your goals until the race is done. The same can be said for swine producers who spend their time, effort and money to produce a market pig, only to have that pig die prior to slaughter.
All closeouts are based on a standardized set of business logic, and calculation algorithms, which allows our analysts and users to make apples-to-apples comparisons of performance across and within companies using the MetaFarms Ag Platform.
Marketing performance analysis was performed utilizing the MetaFarms Ag Platform with specific focus on the U.S. customers only. Sales data was gathered from 17 different packers which excluded all sales data from cull buying locations. In 2022, total market loads exceeded 200,000 which included over 35,000,000 pigs. It should also be noted that only sale loads of 50 or more pigs were included in this study. The average pigs per load averaged 161, with an average live weight of 286.87 pounds and average carcass weight of 215.13 pounds. MetaFarms works directly with most U.S. packers to allow customers to upload summary and detail information which is then assigned to an individual group.
Chart 1 and 2 analyzes the last five calendar years of sales data with a specific look at the dead-on arrivals which is then broken down by month. Market sales are grouped into months by the day that the pigs were delivered. DOAs are classified as pigs delivered that were already dead-on arrival or were euthanized due to reasons such as an animal's wellbeing.
When comparing the information within Chart 1, throughout the five-year span, the average DOA % ranged from a low of 0.21% in 2020, to a high of 0.26% in 2021 and 2022. Does not seem that bad right? Not so fast. If every year had 35,000,000 carcasses, the 0.05% difference equates to 17,500 pigs. With a quick value of $180/head, the economic loss on those 17,500 extra DOAs would be $3,150,000. Summer months bring in warmer temperatures as well as added stress to pigs during transportation. Charts 1 and 2 show trendlines increasing starting in May and lasting until October/November.
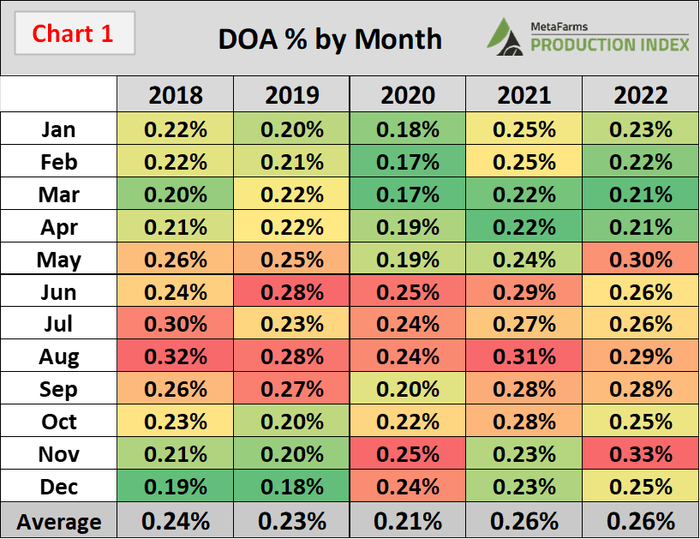
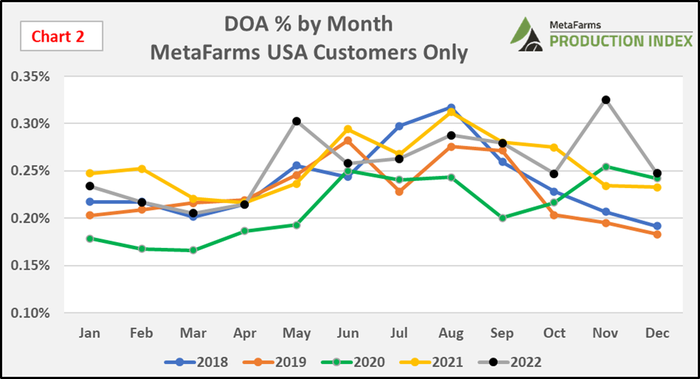
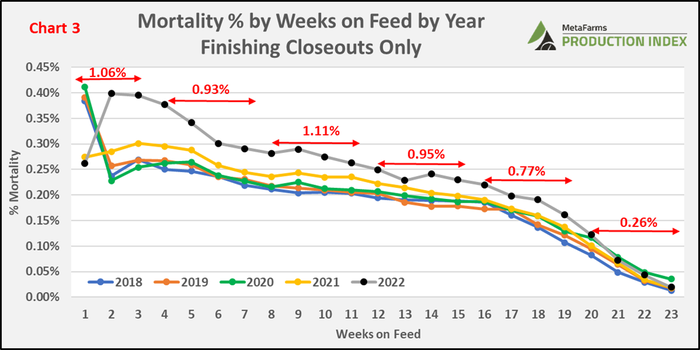
Chart 3 analyzes cumulative mortality percentage for finishing closeout groups between 2018 to 2022. Each data point reflects that week's total deaths divided by total number of pigs in a group. In 2022, the MetaFarms Ag Platform had more than 10,000 finishing closeouts with more than 18,000,000 pigs started. Groups averaged 158 days (22.7 weeks) on feed, with an average mortality percentage of 5.08% across the 23 weeks. Whereas in 2021, the mortality rate was 4.61% for the first 23 weeks.
In 2022, by the end of week three, the average mortality percentage was 1.06% for a 1,000 head group which means that nearly 11 pigs had already been lost (or one dead every other day). The next four 4-week intervals of time on feed had close to or above 1% mortality. The last four weeks on feed, which are groups that are marketing, saw an additional 0.26% death loss. It should be noted that late death loss should not be all associated with transportation losses with other health issues like APP and mycoplasma, playing a role as well.
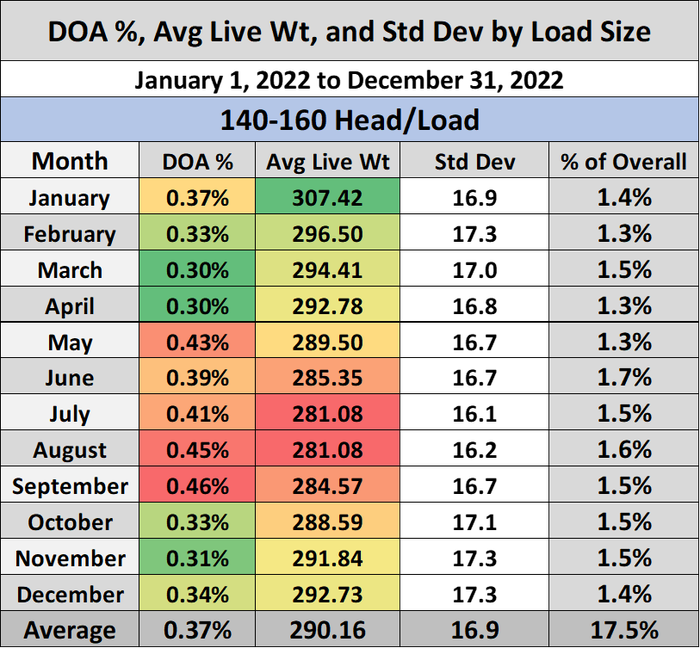
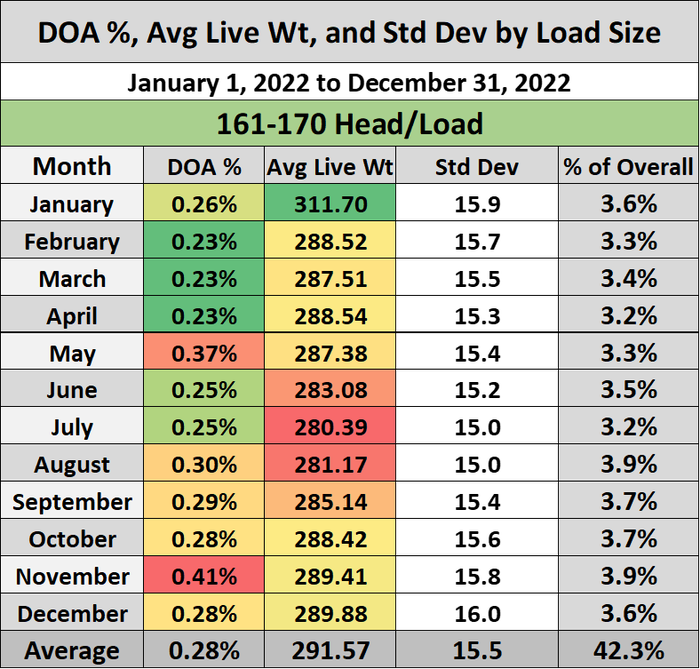
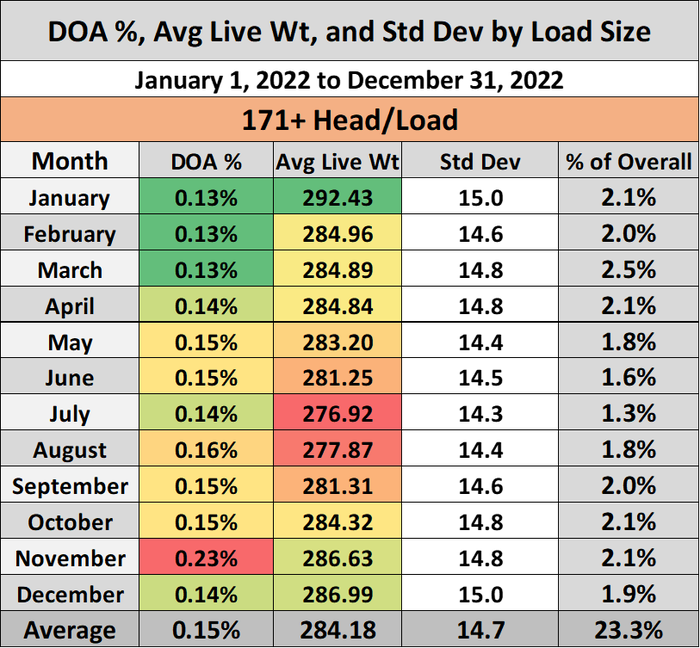
Diving a little deeper into transportation losses, the next three charts show 2022 average DOA percentage, average live weight and standard deviation by month load size. Seventeen-and-a-half percent of all market loads had 140-160 head per load, 161-170 pigs per load made up 42.3% and market loads of 171 or more made up 23.3%. These three charts show a dip in average live weights during the summer but what was interesting to see was that the DOA percentage comparison between the 140-160 pigs/load compared to the 171+ pigs per load. Future analysis could be done to see why the DOA percentage is different but for now, a couple of reasons could be the trailer type (belly versus straight), and the distance from the site to plant.
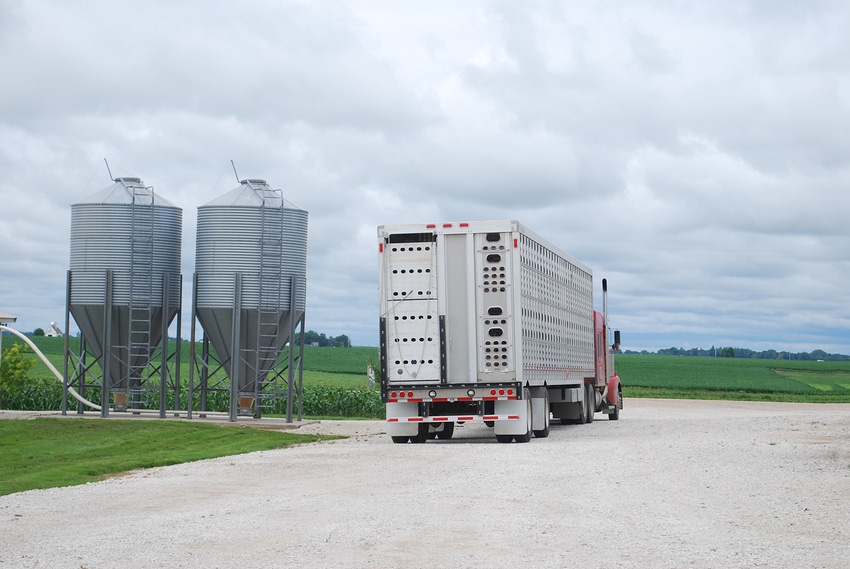
One of the most stressful times in a pig's life is during transportation. Less stress will lead to lower incidents of accidents, injuries and deaths. Below are some tips for those frontline workers of market loads transportation.
Caretakers/Loadout Crews:
Pre-sort pigs prior to your load time with the goal of adequate time for the sorted pigs to relax.
Follow PQA requirements of moving five pigs at a time.
When sorting pigs out of a pen, avoid making too much noise or disruption to the pen and the rest of the room.
Utilize barn lime in the loadout room to lower the risk of pigs slipping.
Ensure cleats in the loadout chute are replaced and in good condition.
When moving pigs, be sure to use sort boards and reduce the usage of hot shots by using other means like rattle paddles.
For early or late day loads, consider utilizing as little light as possible in the barn. With little light in the room and light in the hallway, pigs should head towards the light.
Transportation/Truckers:
Load and unload pigs in a safe, timely and orderly manner.
Load pigs on schedule, especially in the summer, where arriving at the plant early could lead to extra time that the pigs are sitting on the trailer.
In summer months, ensure that the trailer has maximum air flow during transportation. If the trailer has sprinklers available, make sure that all are in working order prior to loading.
Management/Supervisors:
Properly communicate load times, to all involved, to avoid bottlenecks.
Prior to the start of marketing, ensure that the site has adequate lighting, equipment for loading, and barn lime.
Transportation losses can be easy to ignore but can lead to financial and performance impacts on your company. Tracking this information on a daily, if not weekly basis, should be on every producer's "to-do" list. Set company targets, monitor them and when outliers arise, deal with them immediately. Numerous people are involved in getting a pig to market from birth, do not let frustrations or sloppiness end up losing that pig when so close to the finish line.
MetaFarms Analytic Insights were used to provide the context and trends for this article. If you would like to see show an analysis of transportation losses are affecting your performance and bottom line, or if you have suggestions on production areas to be included in future articles, please e-mail or call us. We enjoy being a part of the National Hog Farmer Weekly Preview team.
If you have questions or comments about these columns, or if you have a specific performance measurement that you would like us to write about, please contact: Bradley Eckberg via email.
You May Also Like


