COVID-19 impact on marketing and finish mortality
The impact of COVID on production superseded all other health-challenged years from July-November.
April 7, 2021
In March of 2020, the World Health Organization declared COVID-19 a pandemic. On March 10, 2020, several states made proclamation of a State of Emergency that implemented rules and recommendations to slow the spread of COVID-19. With the unknown uncertainty of how, and when, COVID-19 would impact the pork industry, the answer came a lot quicker, and the effect was felt sooner than the industry was prepared for.
On April 7, 2020, the first temporary closure was a Tyson pork plant located in Columbus Junction, Iowa. Two days later, the West Liberty Foods plant (Located in West Liberty, Iowa) closed for 3 days. The very next day, April 10, 2020, the Smithfield plant in Sioux Falls, S.D. closed briefly but then extended the closure indefinitely.
By April 23, 2020, the U.S. pork slaughterhouse capacity was reduced by nearly 25%, with the Tyson Waterloo, Iowa plant and the JBS Worthington, Minn. plant closing indefinitely. To say that panic set in for producers is an understatement. Producers had to ask themselves questions like: Where do the market hogs go if my packing plant is closed? How much can growth be slowed? What measures need to happen to slow or stop the production cycle? These difficult decisions had to be made, transportation and other unforeseen costs were incurred, pig weights ballooned and frustration abounded when trying to determine when “normalcy” might return for production.
For this conversation, we focused on a few metrics to see what the impact of COVID-19 had on finishing groups’ mortality percentage, days to first sale, and average daily gain. Data analysis and comparison have been done by utilizing the MetaFarms Ag Platform. The MetaFarms Ag Platform had over 200,000 market loads with nearly 33,000,000 carcasses for both 2019 and 2020. Analysis between 2019 and 2020 MetaFarms finishing groups were done over 17,500,000 pigs started each year, which corresponded to 10,000 closed groups for each year. All analysis and comparisons will be done from the MetaFarms U.S. customers only.
As producers scrambled to get pigs sold, many decisions had to be made. One of those decisions was what site and group would get market loads. Reviewing Chart 1, in week 16 (April 12 – April 18, 2020), the MetaFarms platform saw total weekly packer loads drop by 26.2% or nearly 1,500 loads. With an average load size of 158 pigs, that means roughly 237,000 less market hogs were shipped when compared to 2019.
Further analysis comparison between 2020 to 2019 showed that during the next 9 weeks (April 19 - June 20, 2020) market loads were down 24.9%, nearly 14,000 less market loads or 2.2 million less pigs sold.
The week where the widest disparity between 2019 and 2020 occurred in week 19 (April 19 – April 25, 2020) where 53.4% fewer loads were shipped in 2020. That makes up 2,851 fewer loads and 450,000 fewer market hogs.
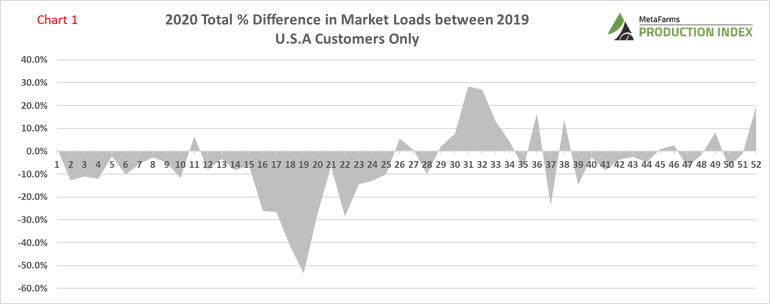
Recovery did not happen quickly, but eventually producers were able to get caught up. But how quickly? Using the MetaFarms Ag Platform, Chart 1 shows the percentage difference in market loads from 2019 to 2020. As previously noted, week 18 (April 26 – May 2, 2020) saw the largest difference, whereas the recovery process really kicked into gear in week 29 (July 12 – July 18, 2020). Week 31 (July 26 – August 1, 2020) had the biggest increase difference from 2019 with more than 2,505 loads sent in 2020 than 2019. That was an increase of 27.6% more loads being shipped, or nearly 400,000 pigs.
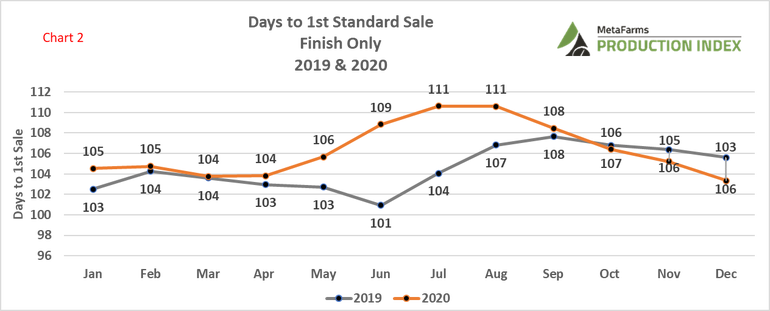
With the need for producers to get sites empty to make room for newly arrived pigs, sites that would normally have been ready for market were put on hold. Chart 2 shows a 2019 versus 2020 monthly comparison for days to first standard sale, which is a metric calculated based on the start date of a group with the first standard (non-cull buying) market sale.
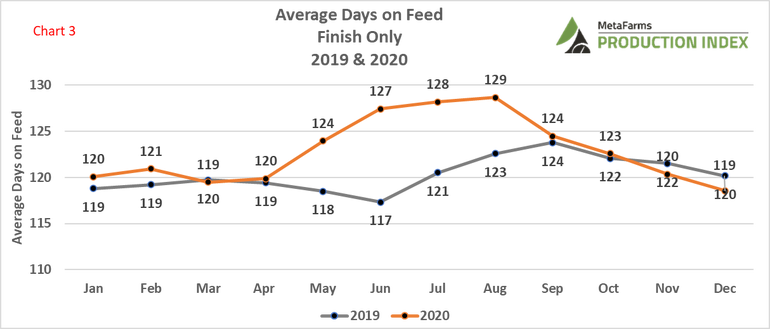
New groups marketing in May-August 2020 waited 3-8 days until getting the first pigs out and thus easing the square footage for pigs. Looking at those finishing groups that were held back and using the metric average daily gain (ADG) for June 2020 of 1.83, eight more days on feed would have added 14.6 pounds to these pigs. Chart 3 compares the impact on average days on feed for finishing closeout groups for 2019 to 2020. May-August saw pigs on feed 6-10 days longer, thus having new pig arrivals pushed back farther than anticipated, even for warm weather summer months.
As packer capacity started getting back to normal, many producers were able to get more market loads, but questions began to arise about the impact the plant closures had on closeout performance. As many producers agree, comparing 2020 closeout performance to previous years will not be as useful, but like any unfortunate event in production, we can use this as an opportunity to educate ourselves for the future. For this month, we will look at the COVID impact on finish closeouts. In future National Hog Farmer articles, a deeper dive analysis will be done for nursery, finishing, and wean-to-finish groups.
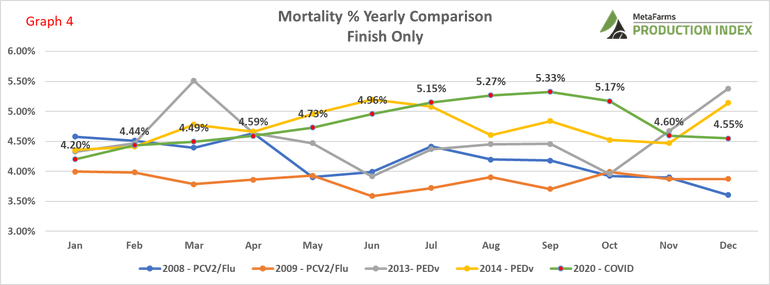
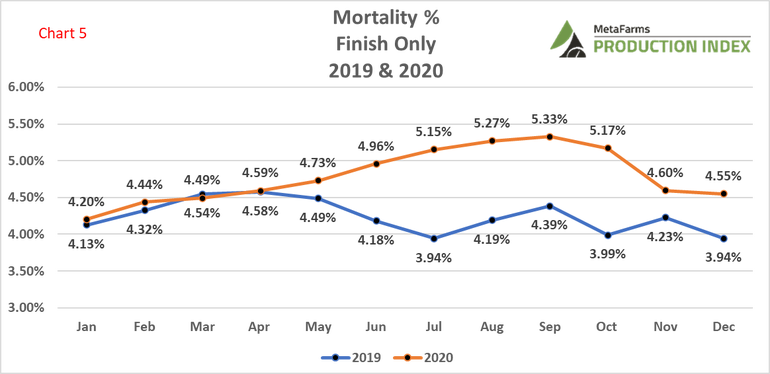
So how much did COVID impact mortality compared to other health challenging years? Could 2020 be worse than other health challenging years? The answer is yes. In 2008, PCV2 and flu hit the pork industry hard, challenging pig survivability. This stretched into 2019 when mortality declined noticeably thanks to vaccines and management of both viruses. 2013 and 2014 had yet another health challenge with PEDv, with a heavier impact on mortality felt in 2014. Chart 4 shows just how much 2020 COVID impacted mortality percentage over other health-challenged years. Earlier calendar months generally had a similar mortality percentage, excluding a spike in March 2013, but after July, COVID impact in 2020 superseded all other years, until finally falling back into normal ranges in November. Chart 5 shows the yearly mortality percentage comparison between 2019 and 2020. January thru April was virtually the same, whereas, starting in May 2020, mortality continued to climb and widen the gap from 2019.
As we look a back at the crazy year 2020 was, we can all be relieved the year is done and hope for a brighter 2021. Spanish philosopher George Santayana was credited with the aphorism, “Those who cannot remember the past are condemned to repeat it.” This saying can be said for a lot of areas in life, and pork production, so hopefully we can all learn from last year’s decisions. If disruption in the food chain happens again, short- and long-term decision planning can be done to minimize losses.
MetaFarms Analytic Insights were used to provide the context and trends for this article. If you would like to see an analysis of how COVID-19 impacted your marketing and finish mortality, or if you have suggestions on production areas to write articles about, please contact Bradley Eckberg or Ron Ketchem.
Sources: Bradley Eckberg, MetaFarms, who are solely responsible for the information provided, and wholly own the information. Informa Business Media and all its subsidiaries are not responsible for any of the content contained in this information asset.
You May Also Like
