The progression of batch farrowing over 11 years
Increasing disease challenges and large sow farms and finisher sites should have producers considering batch farrowing.
I would like to first regress back to 2009 when Mark and I were approached by Dale Miller, then editor of National Hog Farmer, about writing some articles. The first article, “Benchmarking-1,000,000 sows tell all,” was published January 27, 2009. That first year, we wrote 27 articles on a wide variety of production topics. For the next 11 years, we wrote one article per month. This article will be our 182nd article.
We want to thank a wide variety of people—those that sent us topics and did some of the writing, our editors and especially our readers throughout the pork industry. Dale was hard to please and often used the red pen and sent the article back for a rewrite. Now, he takes credit for putting SMS on the map and elevating our career. Mark and I have been involved with the pork industry 42 and 48 years, respectively, and are now starting to step back and move toward retirement. Mark is now working two to three days per week, and I plan to move toward that starting in October. MetaFarms, who acquired SMS back in 2019, intends to pick up where we left off to continue educating and moving the industry forward.
When we were approached by Dale, the first words out of our mouths were, “we are not writers, we are production people.” Some people reading our articles may agree, however, we hope that some of what we wrote was of value to those in the pork industry and provided useful information on how to improve production numbers. Thank you to National Hog Farmer for giving SMS a chance to help the industry.
The first article we wrote about batch farrowing was “How batch farrowing impacts production” and was part of a two-part series published on Sept. 6, 2011 and Sept. 14, 2011, respectively. These articles went back to the mid-70’s when producers started to switch from farrowing one or two times per year to farrowing year-round. The investment was in central farrowing rooms and nurseries that needed to be used more than one or two times per year. That was when I entered the industry with a genetics company and started helping farms switch to a batch farrowing system.
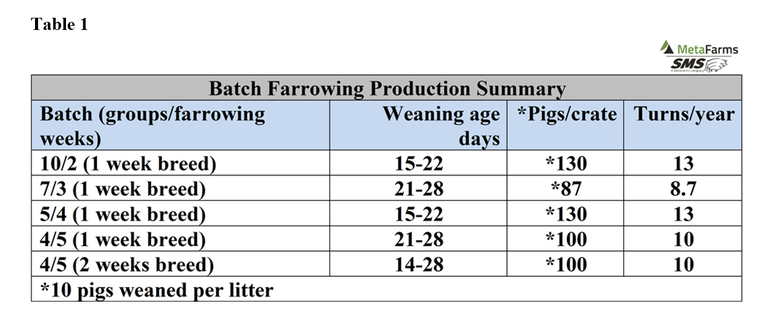
The simplest system was a 2/12 system which was two groups of sows farrowing every 12 weeks. Some farms were more intense going to a 3/8 system which was three groups farrowing every 8 weeks. Table 1 shows the most popular batch farrowing system used when starting out.
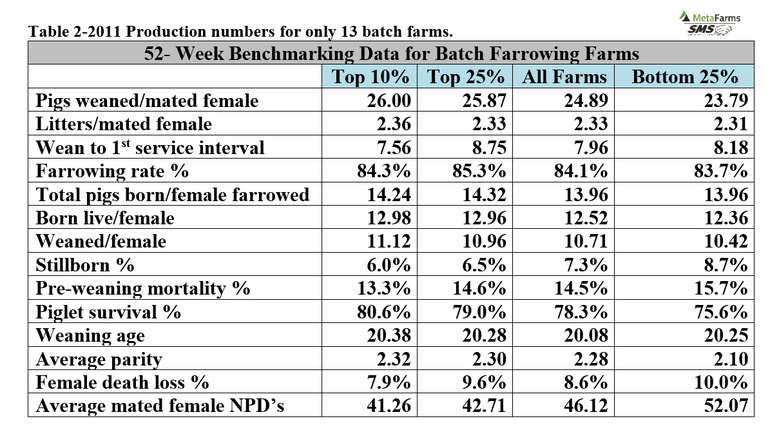
I added Table 2 from that article to show you the production of 13 farms with an inventory range of 250-1,600 sows. Most of these farms were five batch four-week systems with Top 10% at 26.0 pigs weaned/mated female/year with average at 24.89 pigs and Bottom 25% at 23.79 pigs. If you want to review more production numbers, please review Table 2.
In the second article on April 7, 2014, entitled “Should you consider batch farrowing,” we again did a review of where batch farrowing had progressed with 40 farms ranging in size from 237-1,655 sows with 12 of the 40 farms being at 1,000-plus females. The data from that article showed 52-weeks averages for SMS farms Top 10% at 30.12 pigs with all farms average at 25.95 pigs versus batch farms Top 10% at 30.12 pigs and with all farms average at 26.34 pigs. Farrowing rate for SMS farms’ Top 10% was at 91.2% with all farms average at 86.4% versus batch farms’ Top 10% at 90.4% and all at 86.2%. Also total born for SMS all farms was at 13.90 pigs versus batch all average of 14.12 pigs.
Updated data for 2020-2021 about batch farrowing from SMS data is in Table 3, 4 and 5. In the 11 years, batch farming increased to 81 (14.5%) batch farms out of the 559 selected for this article. Farm selected had to be in production 2-plus years and at a minimum of 19 pigs weaned/mated female/year. There were 1,129,000 mated females represented with 89,808 (8.0%) being in batch farms. Average size of batch farms was at 1,109 mated females with weekly farms at 2,174 mated females. Batch farrowing farms now range from 23 farms in a range of 100-500 mated females, 53 farms from 501-2,500 mated females, four farms at 2,501-3,000 mated females and one farm at 3,501-4,000 mated females. This means larger farms are now moving to batch farrowing. I have heard of some systems with sow farms of 5,000-10,000 mated females that are batch. How would you like to be farrowing 1,000-2,000 litters every four to five weeks?
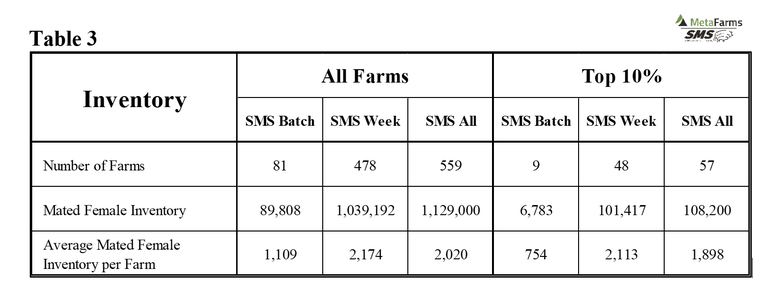
Production Table 4 and Table 5 have data looking at batch versus weekly farrowing. The tables are set up a little different from the past with all farms broke out by SMS batch, SMS week and SMS all so there is a better comparison of batch versus weekly farrowing. There is also a Top 10% comparison of the SMS batch, SMS week and SMS all. Remember that SMS batch has 81 farms, SMS weekly has 478 farms and SMS all has 559 total farms. In reviewing the farms used it, was determined that about 80% of the farms are batch, with most being five group four-weeks system. The other 20% are a combination of two-weeks batches or some hybrid created by some farms to farrowing larger groups of pigs in a shorter window.
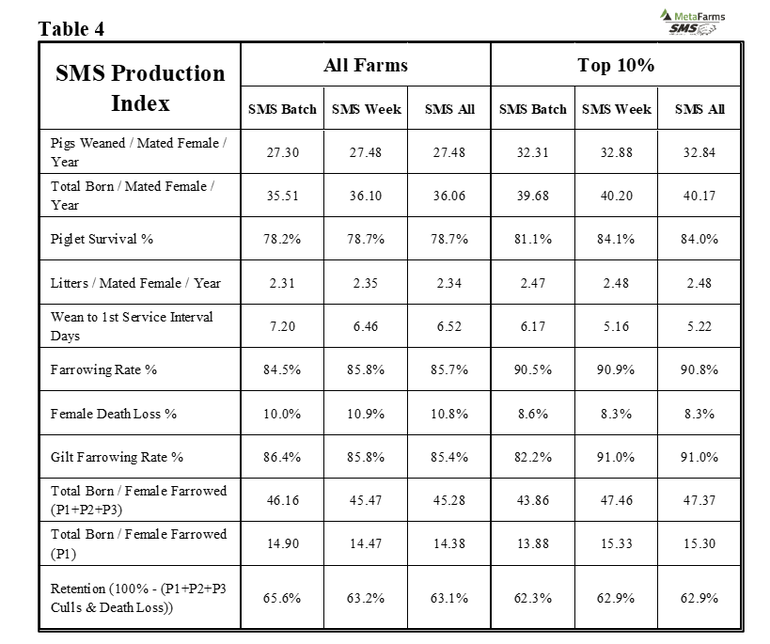
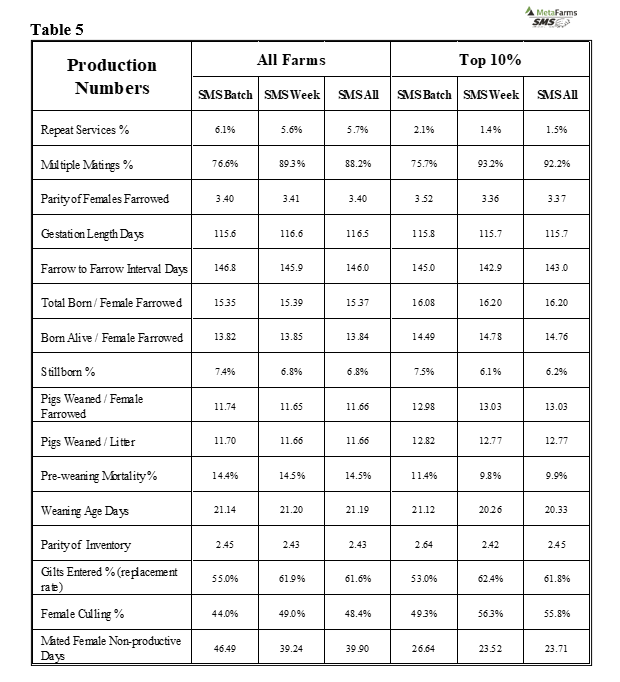
How do the production numbers compare? Looking at pigs weaned/mated female/year, SMS batch all is at 27.30 pigs (81 farms) with Top 10% (nine farms) at 32.31 pigs versus SMS week all at 27.48 pigs (478 farms) with Top 10% week (48 farms) at 32.88 pigs. In comparing batch from 2011, pigs weaned/mated female/year all farm are at 24.89 pigs, with Top 10% at 26.0 pigs. This is an improvement of 2.41 pigs for batch all and 6.31 pigs for batch Top 10%.
There are a large number of production numbers to compare between batch and weekly farrowing in an all farms comparison. Wean-to-first service interval days with SMS batch are higher at 7.20 days versus SMS week at 6.46 days. The higher days are due to a shorter breeding period with weaned sows not breeding having to be carried to the next breeding period. Most of those are P1 females.
Female death loss percentage being an issue now shows SMS batch at 10.0% versus SMS week at 10.6%. No difference. Multiple matings with SMS batch is 76.6% versus SMS week at 89.3%. That number is higher due to some batch farms using OvuGel, which allows for doing only one mating at breeding.
Stillborn percentage is higher for SMS batch at 7.4% versus SMS week at 6.8%. This is probably due to farrowing large groups of sows that are not attended to due to a lack of labor.
Gilts entered percentage (replacement rate) for SMS batch was lower at 55.0% versus SMS week at 61.9%. When reviewing data in the past, that replacement rate was higher for batch farms since a lot of them do not rebreed returns, and in most cases, cull them.
Mated female non-productive days show SMS batch at 46.49 days versus SMS week at 39.24 days. One of the problems with batch is a short breeding window and having to carry some weaned sows to next breeding cycle, or not checking routinely for returns and removing them from the farm. There are many more production numbers in the table for your review.
Like most sets of production data there is a lot of variation between farms. So, we have included Charts 1-4 to show some of that variation.
Charts 1 Batch- pigs weaned/mated female/year: chart is set up with pigs weaned/mated female/year on the X-axis and number of farms is on the left Y-axis. SMS batch farms are the red ones in the columns with the red triangle showing at least one or more SMS batch farms in that column of farms. You see all SMS week farms in range of 19-34 pigs weaned/mated female/year versus SMS batch farms at 21-33 pigs.
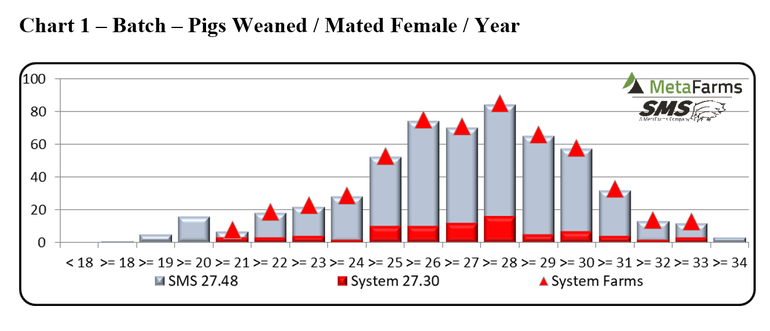
Chart 2 Batch -wean-to-first service interval days: chart is set up with wean-to-first service interval days on X-axis with a range of batch farms of <4 days to >=14.0 days, with most farms in a range of five to seven days. The key to making batch systems work is getting 90+% of weaned sows bred by day seven or less, which means high feed intake in lactation and 8+ lb. from wean to breeding.
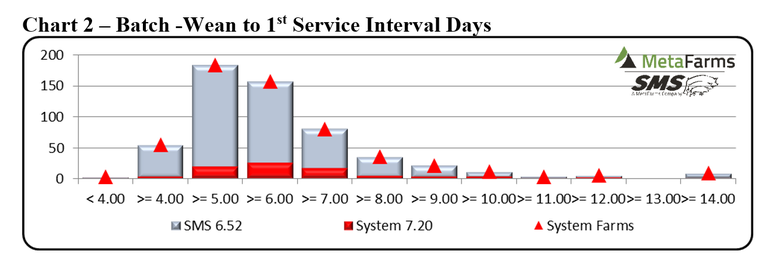
Chart 3 Batch – repeat services percentage: chart has repeat service percentage on the X-axis and number of farms on the left Y-axis. Chart shows a growing number of batch farms re-breeding fewer returns with most of the farm <1.0% to >= 5%. By breeding fewer returns, farms are lowering mated non-productive days.
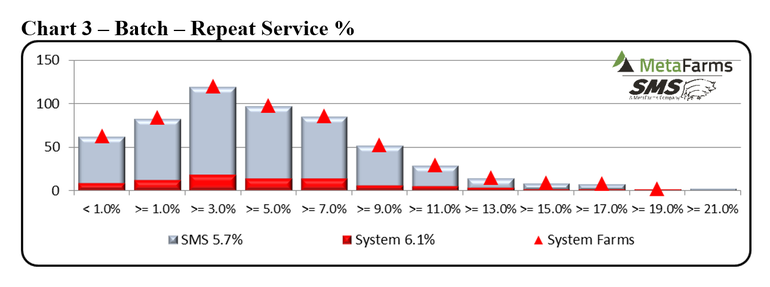
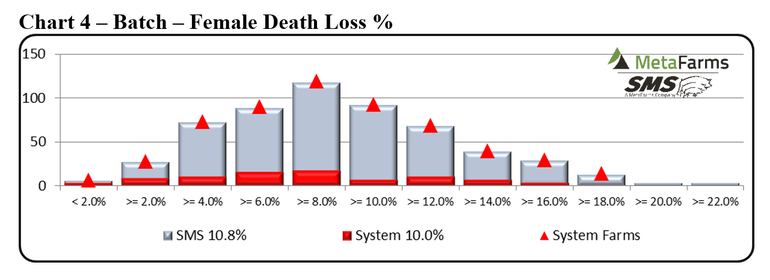
Chart 4 Batch -female death loss percentage: chart shows average female death loss with percentage loss on the X-axis. Average female death loss was 10.0% for batch farms, with a range of <2.0 to >=18.0%.
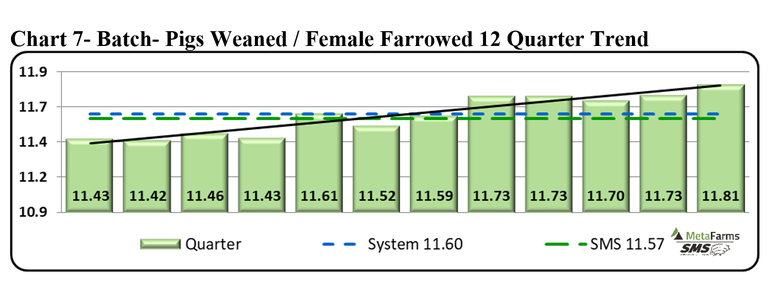
The next 3 charts are set up to show the last 12 quarters (three years) trend lines for the 81 SMS all batch farms.
Chart 5 Batch – pigs weaned/mated female/year during 12 quarters: chart shows SMS batch (81 farms) improving over three years by 1.18 pigs from 26.47 to 27.65 pigs.
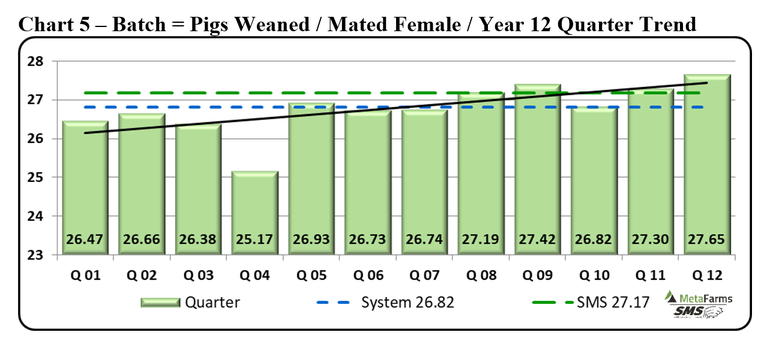
Chart 6 Batch – total born / female farrowed during 12 quarters: chart shows total born moving up from 15.01 to 15.40 pigs for an improvement of 0.39 pigs over the three years.
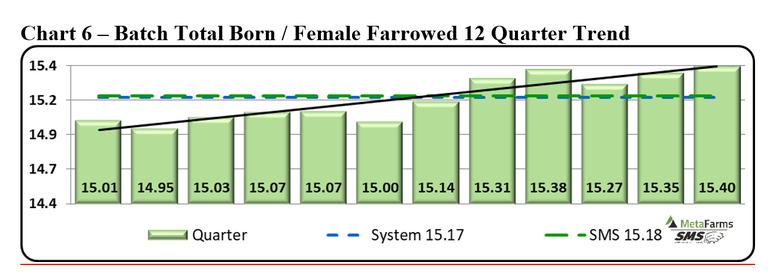
Chart 7 Batch – pigs weaned/female farrowed during 12 quarters: this chart shows pigs weaned per female farrowed over the three years improved by 0.38 pigs from 11.43 to 11.81 pigs.
In summary, the benefits to using batch farrowing include:
improving overall pig health by farrowing pigs in a shorter period and not having multiple age pigs in farrowing
weaning larger batches of pigs about the same age to move to larger finishing barns
large groups of pigs farm sites can be emptied between batches for improved health status and breaking diseases
weaned pigs can be fed closer to the feed budgets with reduced age of pigs
fewer entry of gilts, semen and feed trucks to farm which helps reduce biosecurity risks
production numbers are just as good at weekly with Top 10% as batch farms at 30-plus pigs weaned/mated female
changed labor use, with more work at farm in a shorter period
change of labor requirement, which allows for more weekends off and having days off during the week
ability to have planned vacation on weeks with lower labor requirement
Some negatives to batch farrowing include that it is harder to get groups of gilts into batch flow, that a farm has no or only a few nurse sows to move fallback pigs to and that it is harder to breed returns and get them back into a batch group.
There are many other pros and cons that I have not listed to consider. If you have not looked at batch farrowing, is it time to do the research? With the increasing disease challenges to the swine industry and large sow farms and finisher sites, batch farrowing needs to be explored. Let us know if you have other questions.
Thank you for allowing us to provide these articles to you and the pork industry for 12-plus years.
Ron and Mark
Table 6 provides the 52-week rolling averages for the 11 production numbers represented in the SMS Production Index.The numbers are separated by 90-100%, the 70-90%, the 50-70%, the 30-50%, and the 0-30% groups. We also included the 13-week, 26-week, and 12-quarter averages. These numbers represent, what we feel, are the key production numbers to properly evaluate the farm’s performance.
At SMS, our mission statement is to provide “information solutions for the swine industry.” We feel with the creation of different SMS Benchmarking databases for all production areas, we now have more detailed information to share with the swine industry. If your farm would like to be part of the SMS Benchmarking databases, or if you have suggestions on production areas to write articles about, please e-mail or call us. Previous columns can be found at www.nationalhogfarmer.com
If you have questions or comments about these columns, or if you have a specific performance measurement that you would like us to write about, please contact Ron, Mark, or Brad Eckberg.
Sources: Ron Ketchem, Mark Rix, Swine Management Services LLC, who are solely responsible for the information provided, and wholly own the information. Informa Business Media and all its subsidiaries are not responsible for any of the content contained in this information asset.
About the Author(s)
You May Also Like


