Does gilt farrowing rate predict future farm performance?
A review of how gilts are handled before breeding is probably needed if you want to improve overall herd farrowing rate.
The short answer to the question, "Does gilt farrowing rate predict future farm performance?, is yes. Gilt farrowing rate is one of the key performance indicators for total farm performance. But is it a good indicator for other Parity 1 performance numbers?
We picked 588 farms with 1.110 million mated females in inventory. The farms had to be over 22 pigs weaned per mated female per year, and the farms had to have farrowed through Parity 5 so we could look at retention.
Table 1 shows the performance of all of the farms broke out by the Top 10%, 10-30%, 30-50%, 50-70% and 70-100%. Remember that each breakout are averages for farms in that line. So Top 10% had farrowing rate average for all farms at 90.3% and gilts for those farms had farrowing rate at 90.5%. So, each line represents data from those farms in that line. The farms ranged from 33.85 pigs weaned per mated female per year to 22.06 pigs weaned per mated female per year, with an average of 27.63. Farrowing rate ranged from 75.8% to 97.1% with an average of 86.9%
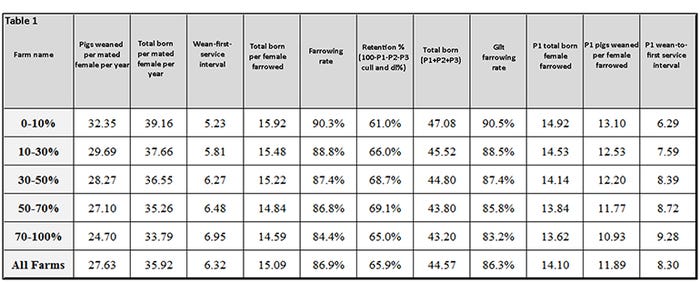
Chart 1 compares the gilt farrowing rate to the total farm pigs weaned per mated female per year and the there is a direct linear relationship to farm performance and gilt farrowing rate. There is a lot of variation in gilt farrowing rate, but the trend line is the better the gilt farrowing rate the higher the pigs weaned per mated female per year.
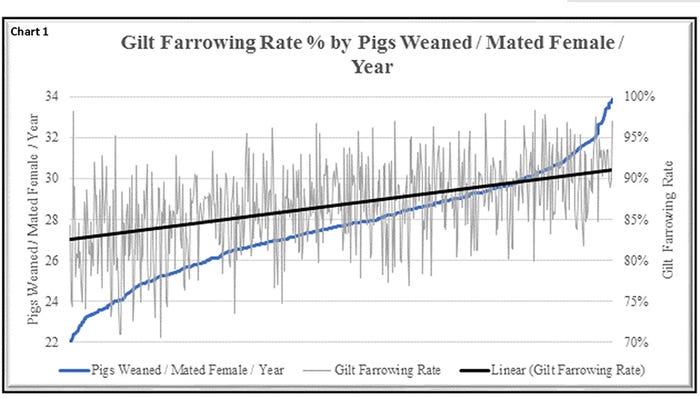
Chart 2 shows the relationship of gilt farrowing rate to the total farm farrowing rate, and again there is a direct relationship of gilt farrowing rate to the total farm farrowing rate.
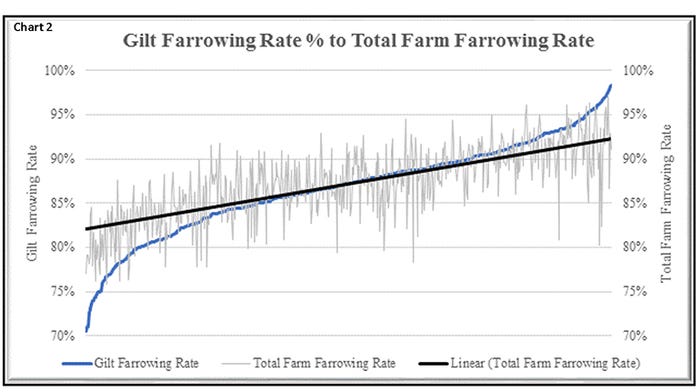
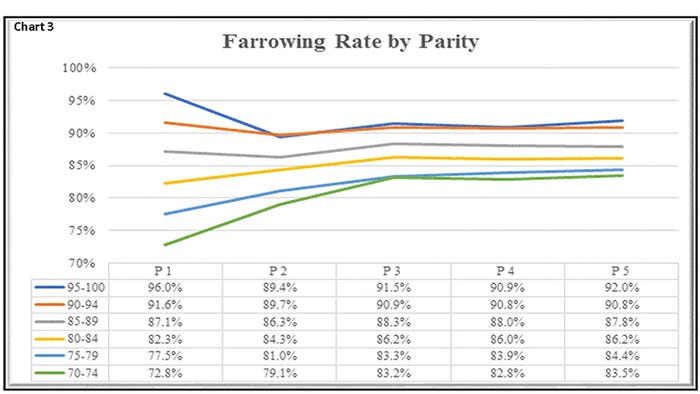
Chart 3 looks at farrowing rate by parity. The farms were group by gilt farrowing rate in 5% increments. Farms that started over 95% gilt farrowing rate were not able to hold that high number, but they continued over 90% for all five parities. However, the overall farrowing rate was higher due to 20-25% of total matings were Parity 0 females. The farms between 90 and 95% gilt farrowing rate were able to stay over 90% for all five parities. Farms between 85 and 90% farrowing rate were able to maintain this farrowing rate but never got over 90%. Farms between 80% and 85% gilt farrowing rate were able to get over 85% for Parities 2 to 5. Farms between 75% and 80% were able to get over 80% farrowing rate but not over 85%. Farms below 75% gilt farrowing rate were only able to get to low 80% farrowing rates.
Sometimes when we started putting together the analysis for these columns, we have a preconceived notion of what the data will show and then we are surprised by the actual outcome. This is one of those times.
Charts 4 to 7 look at gilt farrowing rate compared to other Parity 1 production numbers. Chart 4 looks at gilt farrowing rate compared to Parity 1 total born per female farrowed and we expected to see an increase as farrowing rate went up, but the actual data show the trend line is flat.
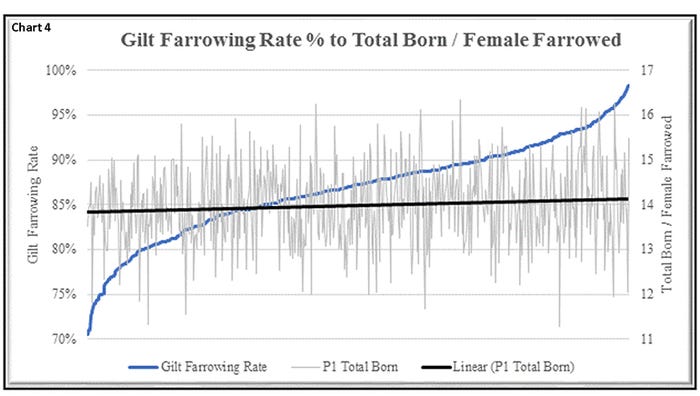
Chart 5 looks at gilt farrowing rate compared to total born for P1, P2 and P3, and again the trend line is flat.
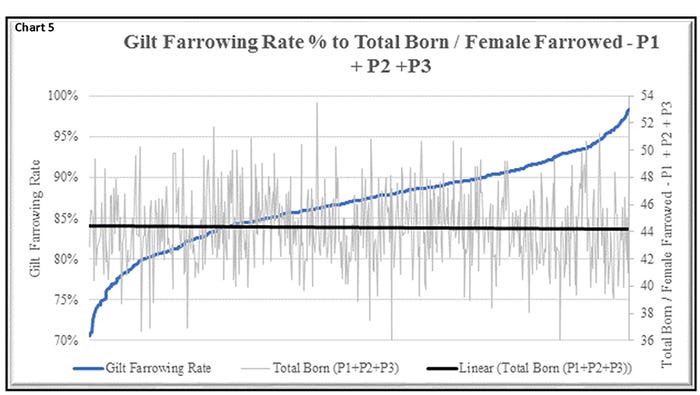
Chart 6 looks at gilt farrowing rate to Parity 1 wean-to-first-service interval and again the trend line is flat.
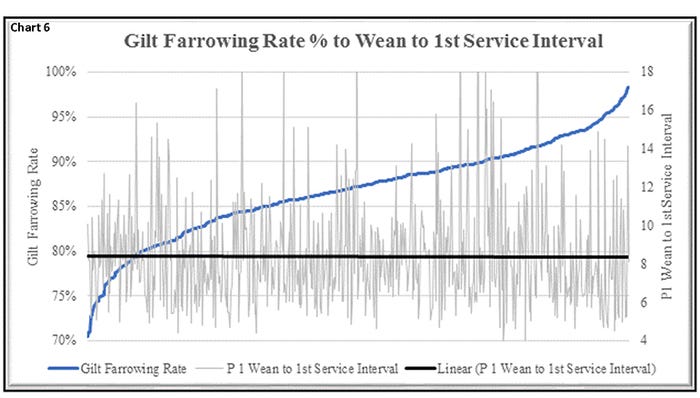
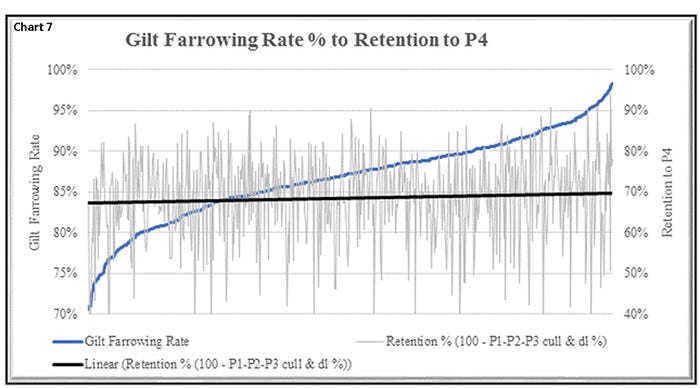
Chart 7 looks at gilt farrowing rate compared to retention to Parity 4. The Swine Management Services' retention calculations look at the females that farrowed as Parity 1 and stay in the herd through Parity 4. This ignores the gilt fall-out because of when the farms enter their gilts, some farms enter gilts as early as 90 days pre-breeding and others enter at breeding time. Again, the retention number is flat when compared to gilt farrowing rate.
What can be done to improve gilt performance? The process begins when the gilts come to the farm in the gilt development unit. Are the gilts given adequate time for acclimatization, are they given exposure to the bugs of the farm by mixing in cull animals for given feedback? When does daily boar exposure start? Do gilts get bred after having had at least one recorded heat cycle? Do gilts get gestation crate exposure before breeding? Are all vaccinations given at least two weeks before breeding of gilts to allow for a period of low stress before being bred? Do gilts weigh at least 300 pounds at breeding? When breeding the first time are gilts getting at least two quality matings?
In some of the data we review a lot of the time farrowing rate is lower for gilts that only got one mating during that breeding cycle. Some of the top farms we work with have gone to AM/PM mating of gilts to reduce the number of single matings which usually helps improve farrowing rates.
Where is your farm at on farrowing rate of gilts? A review of how gilts are handled before breeding is probably needed if you want to improve overall herd farrowing rate. You will also need a plan for getting the gilt farrowing rate up to a target of 90%-plus.
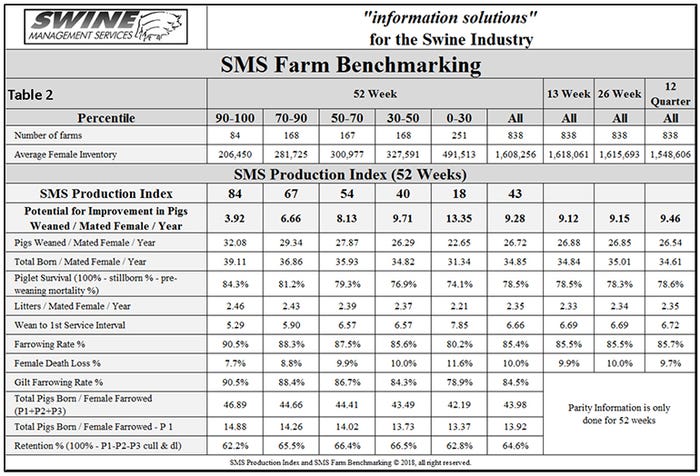
Table 2 provides the 52-week rolling averages for 11 production numbers represented in the SMS Production Index. The numbers are separated by 90-100%, 70-90%, 50-70%, 30-50% and the 0-30% groups. We also include the 13-week, 26-week and 12-quarter averages. These numbers represent what we feel are the key production numbers to look at to evaluate the farm's performance.
At SMS, our mission statement is to provide "Information solutions for the swine industry." We feel with the creation of different SMS Benchmarking databases for all production areas we now have more detailed information to share with the swine industry. If your farm would like to be part of the SMS Benchmarking databases, or if you have suggestions on production areas for us to write columns about, contact Mark Rix or Ron Ketchem. We enjoy being a part of the NHF Daily team. Previous columns can be found at NationalHogFarmer.com.
Sources: Ron Ketchem and Mark Rix, Swine Management Services, who are solely responsible for the information provided, and wholly own the information. Informa Business Media and all its subsidiaries are not responsible for any of the content contained in this information asset.
About the Author(s)
You May Also Like


