USDA Hogs & Pigs Report a Mixed Bag
July 1, 2013

USDA’s quarterly Hogs and Pigs report, released last Friday afternoon, was a mixed bag. Most of the key pieces of data were within 1% of the analysts’ averages in pre-report estimates – but a few key numbers differed substantially. Figure 1 contains all of the key data as well as average pre-report estimates and comparisons of the two.
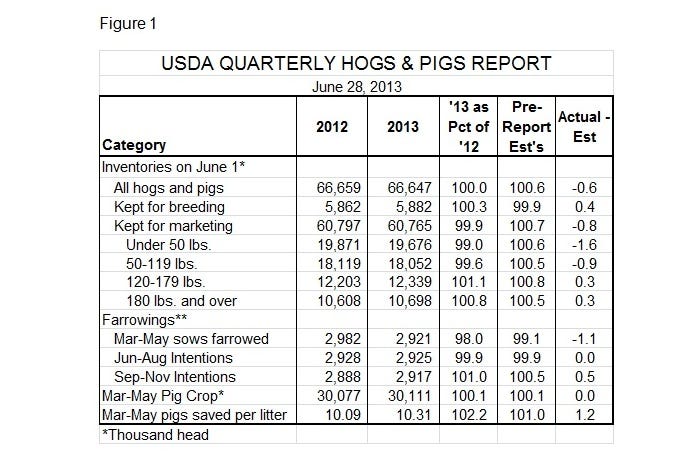
Starting with the market herd of 60.797 million head at 99.9% of one year ago and nearly a full percentage point lower than what analysts expected. The number is driven by lower lightweight hog inventories with the under-50-lb. category being down 1% instead of the expected 0.6% increase. Inventories of hogs weighing 50-119 lb. were nearly 1% lower than expected, suggesting that slaughter from September through December will be lower than many believed going into the report.�
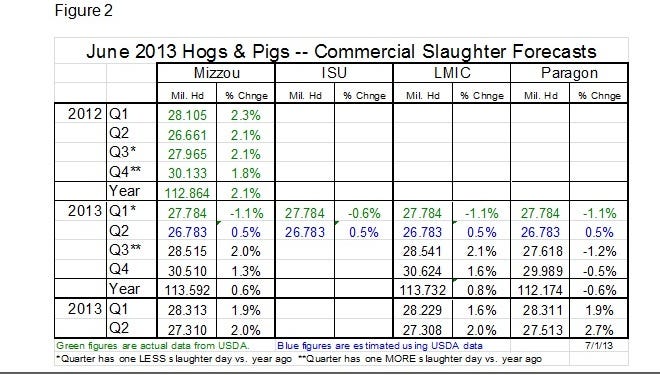
I have Q3 commercial slaughter down 1.3% from last year’s levels. Recall that those were inflated by producers’ efforts to move hogs to slaughter early to avoid using as much expensive feed as possible. My Q4 forecast is for slaughter to be 0.5% lower than one year ago.
Figure 2 contains my quarterly slaughter forecasts, as well as those of the University of Missouri and the Livestock Marketing Information Center. Iowa State’s supply forecasts were not available at the time of this writing.
Heavyweight inventories were quite close to the expected levels. The 180-lb. and over stocks of 10.608 million head were up 0.8% from one year ago. Average daily slaughter during June was 0.7% higher, indicating that the 180-lb.-and-over inventory was quite reasonable. Note that we use average daily slaughter since June this year has one less weekday than did June 2012.
Like what you’re reading? Subscribe to the National Hog Farmer Weekly Preview newsletter and get the latest news delivered right to your inbox every week!
The report does contain one disparity that merits attention. Note that the March-May pig crop of 30.111 million head was precisely equal to analysts’ expectations of the year-on-year number at 100.1%. But arriving at that number was a long and winding road with March-May farrowings falling 1.1% short of analysts’ expectations (2% short of year-ago levels). This decline was made up for by a record average litter size of 10.31 pigs/litter, 2.2% higher than last year and 1.2% higher than analysts’ expectations.
While surprising, all of those numbers fit until one compares that pig crop to the under 50-lb. inventory. Where did 1% of the pig crop go? Some might quickly answer: “Aha! The PED virus!” But I doubt that is the reason. Remember, these inventories were as of June 1 and the pig crop was for March, April and May. Not much had happened with PED virus during those months. PED virus losses may indeed become significant in time – the virus was known to be present on only 115 farms as of May 27, probably not enough to be reflected in the survey or the report. Forty-seven more positive samples were discovered by the week ending June 17, bringing the total to 265 farms.
The breeding herd continues to grow slowly, according to this report. There were 5.862 million animals in U.S. breeding units on June 1, 0.3% higher than last year and 0.4% larger than the average estimate. The herd is 48,000 head larger than on March 1. According to Ron Plain, agricultural economist at the University of Missouri, this growth combined with sow slaughter figures implies that just over 23,000 gilts had been retained during the quarter.
I believe the slightly larger breeding herd and farrowing intentions of 99.9% and 101% of year-earlier levels for the June-August and September-November quarters, respectively, are quite reasonable.
The wild card for slaughter during the first half of 2014 will be fall and winter litter sizes; 23,000 new, improved, better-than-their-ancestors gilts will help make the average litter size larger, but I doubt it can maintain the breakneck 2.2% annual rate we saw in the quarter just past. I have penciled in 1.5% litter size growth and that gives me modest growth in output for the first half of 2014.
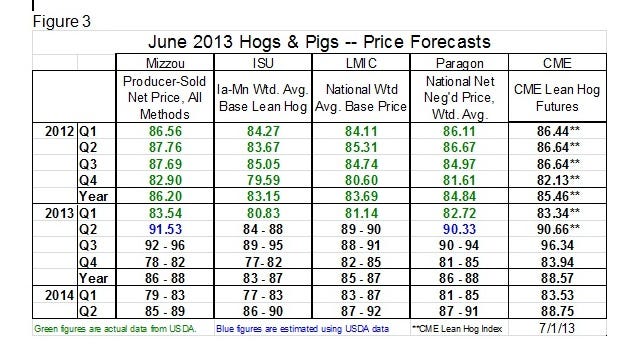
What will be the impact on prices? Not a lot, I think, either relative to where we have been in recent weeks or where we expected to go this fall and winter, even before the report was released. Figure 3 shows price forecasts from four different analysts. There is a bit more disparity than usual among them, but all expect strong prices for the third quarter and a normal seasonal decline into Q4. All but one analyst has a possible $90-plus/cwt., carcass, in mind for Q2-2014.
Note also that Chicago Mercantile Exchange (CME) Lean Hogs futures are priced generally within the forecast ranges for all quarters except Q3-2013. July, August and October futures, the latter of which, of course, impacts September cash hog prices, are high enough that they represent some reasonable pricing opportunities for hogs to be sold through September.
We do not see any other futures contracts that are premium to our expectations for cash hog prices. And we don’t see any that are discounted to those expectations, either, suggesting that the current futures market is providing reasonable pricing opportunities for those who want to reduce hog price risk going forward.
The bottom line is this – measured growth of production capacity and rapid productivity growth that we do not believe will be sustained at this rate but that will yet be significant. The combination means higher supplies in 2014 and lower prices, but not significantly so. The key to profits will continue to be costs, which look favorable given Friday’s crop acreage report. Be ready to lock in very good 2014 margins if corn and soybean meal prices continue to fall.
You might also like:
Senators Offer Bill to Restrict Use of Antibiotics in Food Animals
Watch for PED Virus at Summer Fairs
Corn Acreage Advances for Fifth Consecutive Year
You May Also Like


