Study links employee satisfaction and barn culture to performance
Regardless of your role, what kind of environment have you created to help your team grow and flourish?
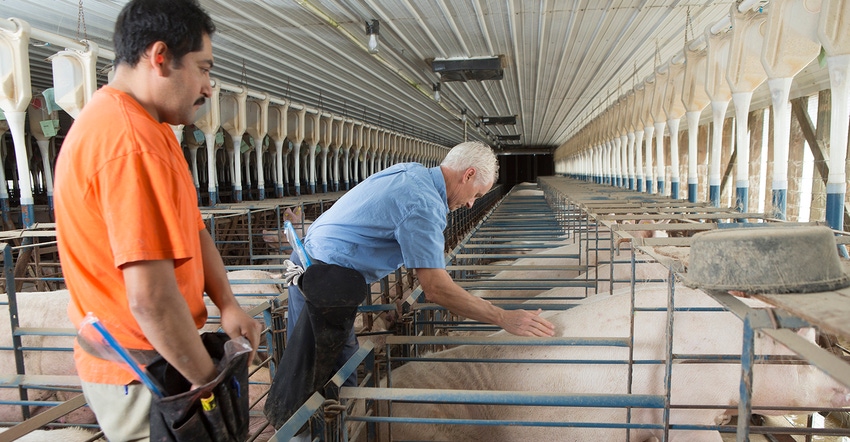
This industry has a labor problem and that is no secret, but we are not alone. This is true of every industry in this country with the federal unemployment rate at 3.7% for July. The high levels of turnover that many farms experience is similar to many other industries that are paying comparable wages.
Swine Management Services was enlisted by Summit Precision Production to cooperate with them on a Labor Intelligence study. The goal of the study was to understand and apply decades of industrial psychology research to biological manufacturing. The use of human intelligence to understand the impact of different personality and psychological profiles of teams with high and low outcomes. We jumped at the chance because of the importance of the issue for producers.
This study consisted of 12 farms from companies that represent 5% of the U.S. sow herd. A total of 103 team members completed a variety of assessments that included general mental ability testing, job interests, personality traits, job satisfaction and employee engagement. Separately, SMS conducted a survey with clients that are part of the Farm Analysis program that asked questions about labor topics along with production and facility-related questions. The data in this article are a combination of results from both of these efforts.
Determining what is fully staffed for a farm used to be pretty standard. Depending on who you ask in the industry you are likely to get a number between 250 and 300 sows per person. In Chart 1, the 12 farms in the Labor Intelligence Study are graphed with the ideal number of sows per team member for each. The four farms represented in green were at 27.5 pigs weaned per mated female per year or higher for the 52 weeks.
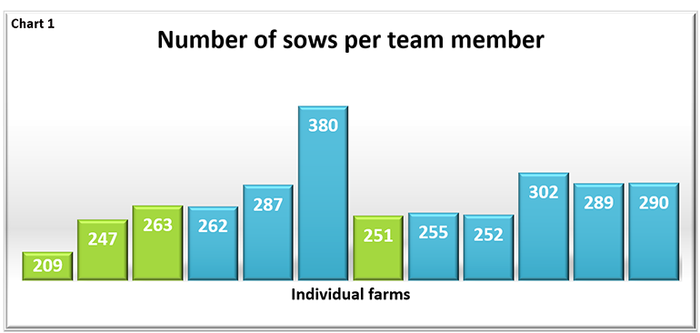
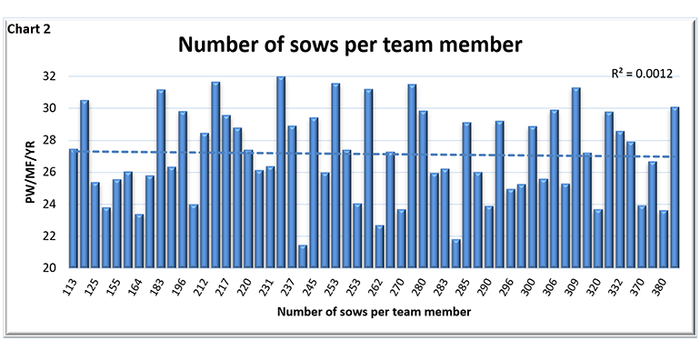
Chart 2 is from a survey that was conducted by SMS looking at the number of sows per team member in relationship to pigs weaned per mated female per year performance. On the 56 farms it shows there is no relationship between the number of sows per person and the performance of the farm. There are many things that need to be considered when determining how many to staff a farm with including the design of the facilities, is the gilt development unit located on site, is barn maintenance handled internally, and more. This also indicates that it isn’t just about how many people are on the farm but what they do drives the performance.
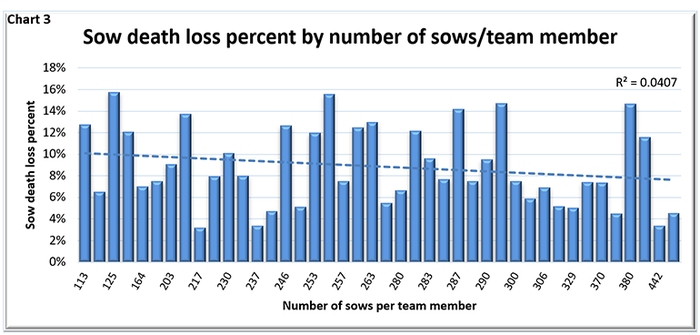
In Chart 3, the number of sows per team member also does not impact sow death loss. In this graph farms that are a pure sow base were excluded. As with Chart 2 there is no relationship between the number of sows per team member and sow death loss.
Justin Wiegand of Sift HR (a Summit collaborative partner) utilized the data in this study to develop job fit models for sow farm managers, supervisors (barn leads) and entry level farrowing and breeding/gestation technicians through an assessment called PXT. The assessment along with the interview process is twice as effective in predicting the future performance of a team member compared to interviewing alone. In this study, farm performance was not related to the staff age, experience or even pay. What did drive farm performance was:
Job satisfaction
The supervisors’ assessment of task performance or how well the team member does their job
The supervisor’s assessment of their helping behavior or how willing are they to help others do their work
Rehire agreement or how likely is the supervisor to hire them again knowing what they know now.
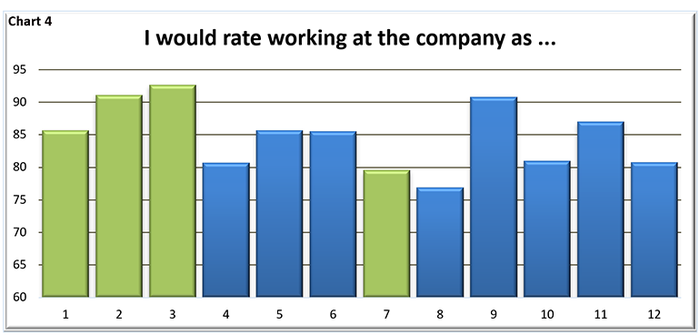
There was a small relationship between pay and the supervisor’s agreement to rehire. Job satisfaction also had a moderate to strong relationship to the supervisor’s agreement to rehire the person. Chart 4 shows the 12 farms in the study and the average for the assessed team members who were asked, I would rate working at this company as (using a scale of zero to 99). The four farms in green are the farms at 27.5 pigs weaned per mated female per year or higher and averaged 90.6 while the other eight farms averaged 82.2.
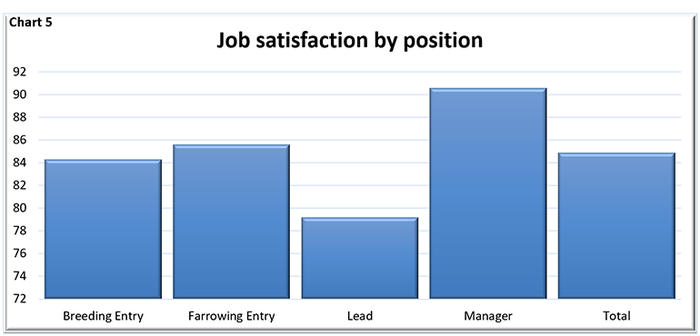
In Chart 5, the average score for job satisfaction is graphed by position in the farm. The entry level breeding and farrowing positions are nearly equal in their job satisfaction. Farm managers had the highest score while the leads were the lowest. It is unclear what would drive the differences between those two positions.
When task performance, the supervisor’s agreement with rehiring an employee, the employees helping behavior and the employee’s job satisfaction were regressed the results of it were quite staggering. For every scale point increase in task performance pigs weaned per mated female per year improved 0.95 pigs weaned per mated female per year and another 1.08 improvement in pigs weaned per mated female per year for each scale point increase in job satisfaction. The complete regression explained 25% of the variation in pigs weaned per mated female per year for the farms in the study.
It is known intuitively that job satisfaction generally results in better performance. The missing piece in our industry today is developing tools to build culture and performance around the metrics that impact production. The future is precision people management. Performance monitors to measure human output as it correlates to pig production metrics.
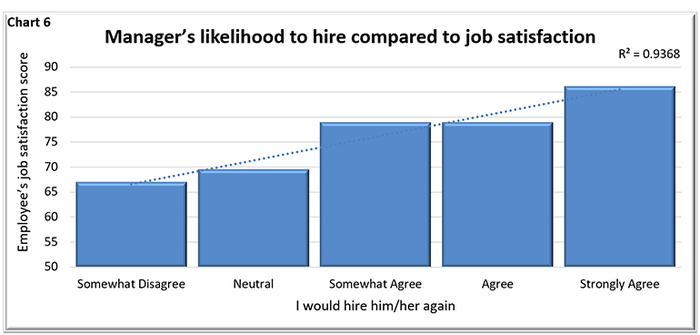
In Chart 6, the managers agreeability to rehire is compared to the team member’s job satisfaction. The more likely the manager was to rehire, the happier the team member is in their role as well. Or as a manager, think about who you are unhappy with and there is a good chance that they are unhappy in their role.
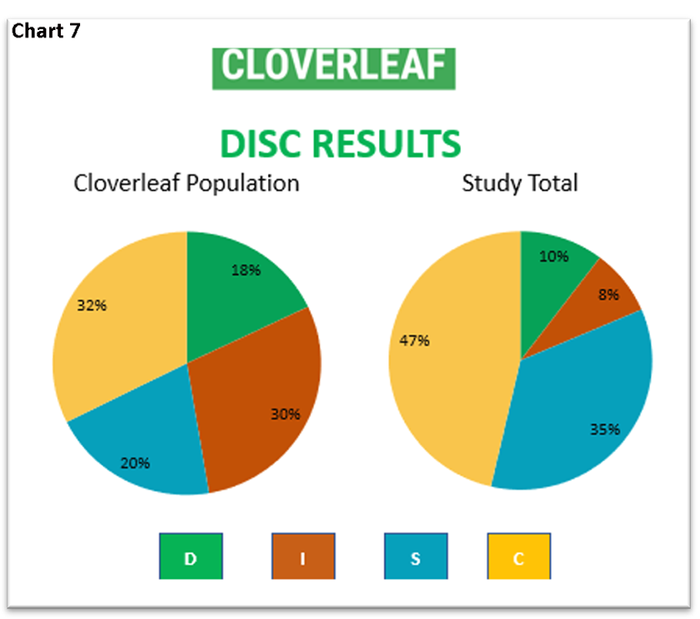
Another component of the study was looking at personality types of the barn workers. Using the Cloverleaf platform team members completed five different assessments, the most notable of them being the DISC assessment. Chart 7 shows the entire Cloverleaf platform containing 32% in the “C” quadrant which are known for their cautiousness, while 47% of the study participants are “C”s. They love rules and details. Then 35% of the those in the study were in the “S” or steadiness quadrant compared to 20% on the Cloverleaf platform. They are known for being team players, they are concerned about how everyone feels and are often slow to make decisions or accept changes. Then 10% of those in the barns are in the “D” or decisive quadrant compared to the Cloverleaf platform with 18%. “D”s are all about getting the job done and not always great with details or small talk. Finally, just 8% of those in the barns are in the “I”, or interactive, quadrant compared to 30% in the Cloverleaf platform. “I”s are outgoing, impulsive and can lose focus, but they are creative, fun to be around and a cheerleader for everyone.
While there isn’t a right or wrong personality style for any job, certain styles are better suited for certain roles. This study shows that there were high-performing team members in all personality styles. The “C”s had the highest overall job satisfaction score while the supervisor rating was highest for the “D”s. Personality assessments are a great asset to everyone in an organization, they provide insights into how people think, respond to stress and even what motivates them. Knowing these traits can allow team members to understand each other’s natural tendencies and help to avoid some workplace conflict.
Our world is ever changing, and the way people view their job and careers has changed a great deal. The book, “It’s the Manager” by Jim Clifton and Jim Harter, shares the biggest changes from Gallup. Millennials and Generation Zs are now seeking the following.
They want to work for a purpose not just a paycheck.
They are more interested in development than free food.
They desire coaches and not bosses.
They want continual feedback on performance not annual reviews.
They want to develop strengths and not focus on weaknesses.
A job is no longer a job but their life.
All of these are summed up very nicely in this quote from the book “When you have great managers who can maximize the potential of every team member, you have delivered on the new global will: a great job and a great life.” What greater purpose is there in life than helping to feed to world?
Changing times call for changing approaches to the way we do just about everything. Changing the approach to managing team members is no different. Millennial and Gen Zs are making a decision about how long they stay with a company the very first day and week on the new job, making the onboarding and first impressions more important than ever. Regardless of your role, what kind of environment have you created to help your team grow and flourish? What do you need to change to make it even better?
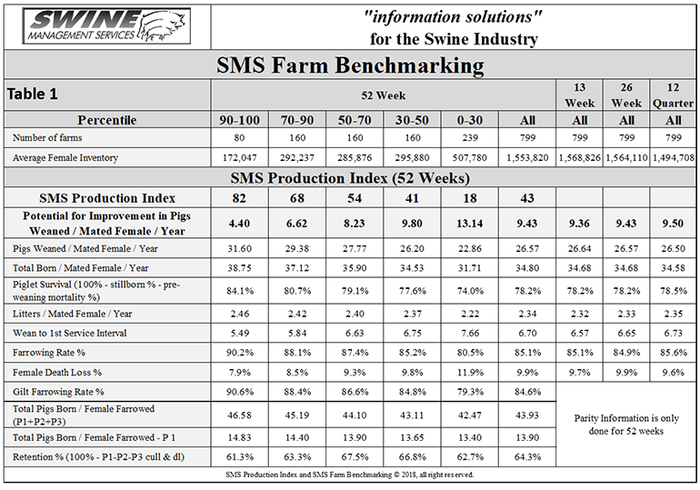
Table 1 provides the 52-week rolling averages for 11 production numbers represented in the SMS Production Index. The numbers are separated by 90-100%, the 70-90%, the 50-70%, the 30-50% and the zero-30% groups. We also included the 13-week, 26-week and 12-quarter averages. These numbers represent what we feel are the key production numbers to look at to evaluate the farm’s performance.
At SMS, our mission statement is to provide “information solutions for the swine industry”. We feel with the creation of different SMS Benchmarking databases for all production areas we now have more detailed information to share with the swine industry. If your farm would like to be part of the SMS Benchmarking databases, or if you have suggestions on production areas to write articles about, contact Mark Rix, Ron Ketchem or Valerie Duttlinger. We enjoy being a part of National Hog Farmer NHF Daily team. Previous article can be found at NationalHogFarmer.com.
Sources: Ron Ketchem, Mark Rix and Valerie Duttlinger, Swine Management Services LLC, who are solely responsible for the information provided, and wholly own the information. Informa Business Media and all its subsidiaries are not responsible for any of the content contained in this information asset.
About the Author(s)
You May Also Like

