SMS Database Revision Reveals Intriguing Production Trends
January 6, 2014

As we start the New Year we are excited about the changes that have been made to the Swine Management Services, LLC (SMS) database used for farm benchmarking. The last few months SMS has been updating the format for the Farm Benchmarking report. To get the additional parity information that was needed going forward, the database was cleaned out and reloaded with more detailed data from the cooperating farms. The rebuilt database is now at 630 farms that have a female inventory of 1,193,547 sows. Farms are from the United States, Canada, and China. The more detailed information contained in the Farm Benchmarking database allows us to analyze and share even more production data with Weekly Preview readers.
Readers will note that Table 1 SMS Farm Benchmarking presents summary data in a new layout. The breakdown is now 90-100th percentile (top 10%), 70-90th percentile (next 20%), 50-70th percentile (next 20%), 30-50th percentile (next 20%), 0-30th percentile (bottom 30% of farm) and an “All” average for the last 52 weeks. Readers can also see a 13-week, 26-week, and 12- quarter average for all farms. The report shows how many farms and sows make up each percentile. Along with the SMS Production Index, which is made up of 11 production numbers, there is a line that shows the Potential for Improvement in Pigs Weaned / Mated Female / Year. The typical production numbers of Pigs Weaned / Mated Female /Year, Total Born / Mated Female / Year, Piglet Survival Percentage, Litters / Mated Female / Year, Wean to First Service Interval days, Farrowing Rate Percentage, and Female Death Loss Percentage are shown.
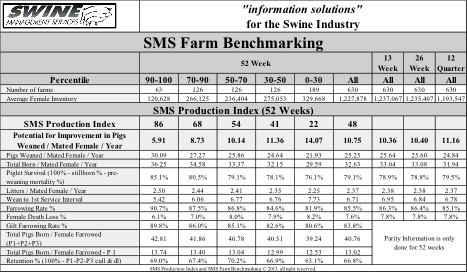
We have added three new production numbers to be used to compare farms: Gilt Farrowing Rate Percentage, Total Pigs Born / Female Farrowed (P1 + P2 + P3), and Retention Percentage (100 – P1 – P2 – P3 cull and death loss). These numbers we see as drivers to improving pigs weaned / mated female / year. This chart will be updated every month in the articles we write.
More detailed data being collected for each farm means that we can create more charts and tables. The production data will be presented in a figure that combines a chart showing the trend lines and a data table that was used to create the chart.
Production trends
We have created five figures showing production trends for this article. The data used was from the 630 farms in the database, broken out by the last 12 quarters, with the ending date of September 29, 2013.
Figure 1, “Pigs Weaned / Mated Female / Year,” shows the last 12 quarters (3 years) and illustrates the improvement for “All Farms” from 23.61 pigs to 25.64 pigs, which was an improvement of 1.59 pigs.
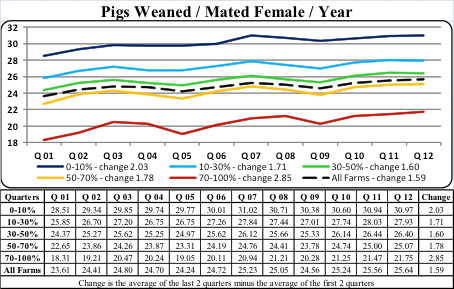
The bottom 30% of farms (70-100%) consisted of 189 farms which improved by 2.85 pigs, from 19.21 to 21.75 pigs. The 63 farms making up the top 10% (0-10%) went from 28.51 to 30.97 pigs, which means a gain of 2.03 pigs. This was an improvement of 7.1% and equals .17 pigs per quarter. Also note that in Q12 the 0-10% farms were at 30.97 pigs. The 70-100% (bottom 30%) were at 21.75 pigs, which was a difference of 9.22 pigs weaned / mated female / year.
Producers can see the real production potential for farms by looking at Figure 2, “Total Born / Mated Female / Year.” During the last 12 quarters, all farms have gone from 30.14 to 33.04 pigs, which is 2.25 more pigs. This shows the continued genetic improvement going on in the industry. The 70-100% group improved the most, going up by 4.58 pigs versus the 0-10% at 1.04 pigs. The blue line shows that the genetic improvement for the top farms for total pgs born is slowing down or peaking. The bottom 30% farms (70-100%) are continuing to show more improvement (refer to the red line). Please note that there is still seasonal variation in production which affects the farms in the bottom 30% more than the top farms.
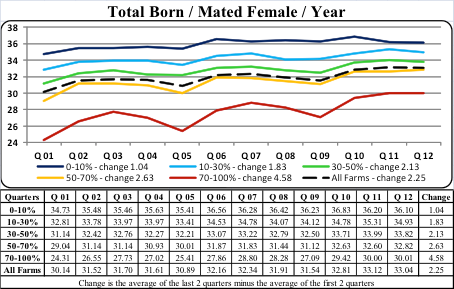
Figure 3, “Piglet Survival” (figured using the formula: 100 – stillborns % - pre-weaning mortality %) evaluated how well pigs are managed in the farrowing rooms. This equation was created a few years ago to adjust for how dead pigs were classified as either a stillborn or death in farrowing. During the last 12 quarters, the “All farms” category has shown an average of 79.0%, with a drop of 0.9% during this time.
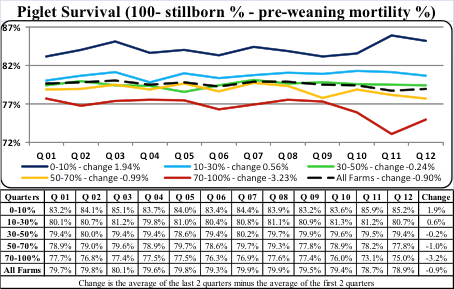
As the figure shows, the 0-10% (Top 10%) improved by 1.9% from 83.2% to 85.2%. If you look at the table and chart you will see that most of that improvement took place during the last four quarters. We feel that these farms had peaked out in total pigs born and to get more pigs weaned have improved Day One pig care, and in many cases, extended the hours someone is attending sows farrowing in order to lower stillborns and reduce chilling of pigs after birth. The 70-100% group showed a drop of 3.2% over the course of the last 12 quarters. This group of producers have not made changes to management in farrowing to take advantage of the extra pigs being born.
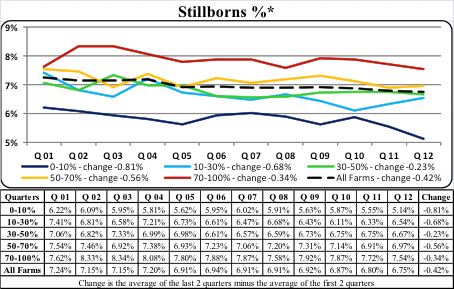
Figure 4, “ Stillborn %,” and Figure 5, “Pre-weaning Mortality %,” are the two components of Piglet Survival. The Stillborn % trend line (Figure 4) for the last 12 quarters has been down with an improvement of 0.42%. The 0-10% farms are leading the way with a drop of 0.81% during the last 12 quarters, with Q10 to Q12 dropping to just over 5% stillborns.
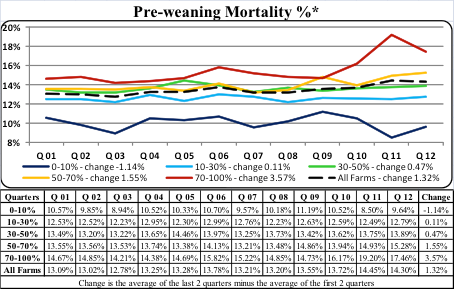
In Figure 5 there has been an increase in the Pre-weaning Mortality % of 1.32% during the last 12 quarters from 13.09% to 14.3%. The bottom 30% farms (70-100%) are losing more pigs, with the trend line moving from 14.67% to 19.2% during Q 11, and 17.46% during Q 12 (see red line). Does this jump start to reflect the PEDV going around the country? The 0-10% farms continue to refine Day One pig care and saw a drop of 1.14% in pre-weaning mortality percentage during the last 12 quarters (see the blue line).
At SMS, our mission statement is to provide “Information solutions for the swine industry.” We feel with the creation of the new Farm Benchmarking database we now have more detailed information to share with the swine industry. If your farm would like to be part of the Farm Benchmarking database, or if you have suggestions on production areas to look at, feel free to e-mail or call us. We are looking forward to the year 2014 and being a part of the National Hog Farmer Weekly Preview team.
Previous Production Preview columns can be found at www.nationalhogfarmer.com.
SMS Production Index
Table 1 provides the 52-week rolling averages for 11 production numbers represented in the SMS Production Index. The numbers are separated by 90-100%, the 70-90%, the 50-70%, the 30-50% and the 0-30% groups. We also included the 13-week, 26-week and 12-quarter averages. These numbers represent what we feel are the key production numbers to look at to evaluate the farm’s performance.
If you have questions or comments about these columns, or if you have a specific performance measurement that you would like us to write about, please contact: [email protected] or [email protected].
Like what you’re reading? Subscribe to the National Hog Farmer Weekly Preview newsletter and get the latest news delivered right to your inbox every week!
You might also like:
2014 Looks Good for U.S. Pork Producers
Pace of PEDV Cases on the Rise
You May Also Like


