Risk management in volatile times
Too many times we look at what was left on the table or how we did at picking the best market, which is rarely accomplished.

Managing market risk in the swine industry has become more challenging in recent quarters due to a number of emerging issues. The biggest of those are trade-related issues, demand issues created by more supply and increased packer capacity impacting supply chains. In addition, we have a lot of uncertainty — particularly in some areas of the country — regarding grain cost this fall.
The resulting large market moves and price changes make you wonder about your strategy and how to implement any meaningful margin management program.
When we get in times like these, for me, the best thing to do is re-examine our strategy and regroup based on what we are trying to accomplish. That sounds overly simple, but I think many lose sight of their goals when they have passed up an opportunity to sell October hogs at $95 and today they are trading at $62.
Strategic goals
Strategic goals for margin management should be based at least in part on the financial position of the farm. I am going to assume that over the long-term you are not going to outguess the market and end up selling pigs on the board for more than you would have received. In other words, what I take from the market will likely end up back there on the back side of the market move. Even so, by frequently evening out the dips in the market you can continue to progress financially.
So, for a farm with no debt today taking what the market gives me doesn’t concern me as much. But for those carrying considerable debt, due to an expansion and taking on more leverage, settling for what the market gives me could put my farm at risk. If instead of taking market risk off the table (which is what the futures markets were designed for) those losses are taken by the farm, a challenging financial situation can end up even worse.
Execution
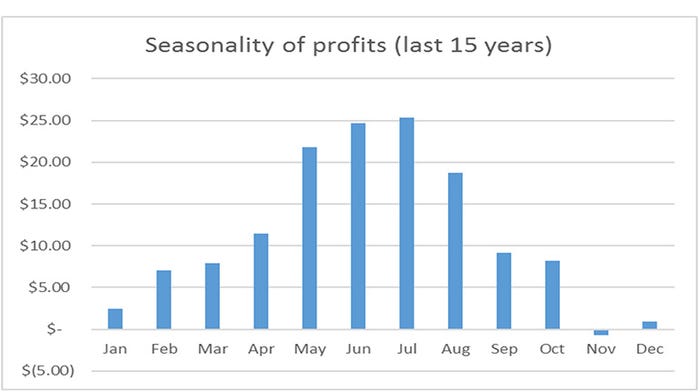
Executing the strategic plan is another issue. For many, if the goal is to reduce market exposure by maintaining the next six months’ coverage between 50-75%, how do you get there? Looking at your current position, relative to history, for each trading month is a popular and useful comparison. Looking at historical profitability is almost always a worthwhile exercise, but we must remember we still have a very strong seasonal tendency in this industry.
Below is a 15-year average of profitability based on the Iowa State University model of returns. The resulting average is $11.42 profit per head if your revenue and cost match the ISU model.

Reviewing results
Don’t overlook the important, ongoing step of reviewing results. Sure, individuals look at the gain or loss from hedging and option activity on a monthly, quarterly or annual basis; but a thorough review should be one of reviewing the original goals of the strategy, how successful execution was, and whether or not original goals were met. Too many times we look at what was left on the table or how we did at picking the best market, which is rarely accomplished.
Source: Kent Bang, Compeer Financial, who is solely responsible for the information provided, and wholly owns the information. Informa Business Media and all its subsidiaries are not responsible for any of the content contained in this information asset.
About the Author(s)
You May Also Like


