Key financial indicators for commercial success
In-process yardage costs are some of the most challenging to monitor, thus easy to ignore. However, they account for approximately 25% of COP and warrant the time spent monitoring.
March 27, 2019

By Drew Hesker, director of Financial Planning and Analysis, The Maschhoffs
Financial measures such as debt to equity ratio, profit margin and cost of production are likely towards the top of most producers list of ways they monitor the success of their operation. Rightly so, as these are important when analyzing your financial health, communicating with your banker or benchmarking against the industry. However, they are lagging indicators of performance and can cause delayed reaction to challenges on the farm.
To stay ahead of cost increases, and ensure the aforementioned metrics will look good at year’s end, a majority of your financial review time should be spent consuming in-process cost information.

Hesker says the change in the cost per head in inventory should be highly correlated to the change in feed ingredient costs.
In-process yardage costs are some of the most challenging to monitor, thus easy to ignore. However, they account for approximately 25% of COP and warrant the time spent monitoring. Here are some key in-process yardage items to keep your eye on:
Each payroll cycle, you should benchmark the labor costs per piglet produced or per average head in finishing against prior payroll periods.
Set a repair and maintenance budget for the year on a per head basis and closely track spend against that budget. Setting the target per head enables you to spend more if production is up and know when repair and maintenance items should be delayed if production is down.
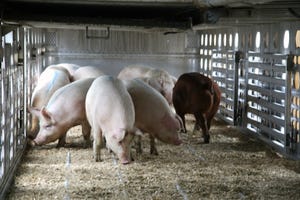
Review space utilization metrics in finishing such as fill time. The quicker you fill the barn, the sooner you’ll be able to market the last load and fill the barn again. Filling the barn 2 days quicker can lower COP by $0.20 - $0.25/head.
Additionally, monitoring in-process costs across all expenses buckets is achieved by tracking the cost per head in inventory in comparison with the average age of the head. The change in the cost per head in inventory should be highly correlated to the change in feed ingredient costs. Most producers keep a keen eye on feed costs since they are over 50% of COP. Use this information to overlay the change in both costs monthly. When they become less correlated, it’s time to dig deeper into the other expense areas such as animal health and reproductive costs.
Tracking and controlling in process costs such as yardage many months prior to them appearing on your financials will set you up for success when using the lagging financial metrics to submit to your bank or benchmark against the industry.
Source: Drew Hesker,The Maschhoffs, who is solely responsible for the information provided, and wholly owns the information. Informa Business Media and all its subsidiaries are not responsible for any of the content contained in this information asset.
You May Also Like


