Evaluating Finishing Closeout Data
May 12, 2014
At Swine Management Services (SMS) we believe “What you don’t measure, you can’t improve.”
The hardest part of analyzing finishing closeouts can be determining if one closeout was better than another, and wondering if you are making improvements in overall performance. When looking at closeouts over time, producers run into changes in market prices for the live-hog and input cost of feed, etc., that makes looking at the profit or loss impractical.
We introduced the SMS Farm Benchmarking and SMS Production Index to sow farms several years ago as a tool to help monitor farm progress over the previous 12 quarters. After several years of thought and development, we came up with the new SMS Closeout Benchmarking and SMS Production Index for Nursery, Finisher and Wean-to-Finish operations. The SMS Benchmarking Index will track a producer’s most recent 1,000 closeouts and will provide graphs depicting the last 100 closeouts, with analysis of 22 production numbers.
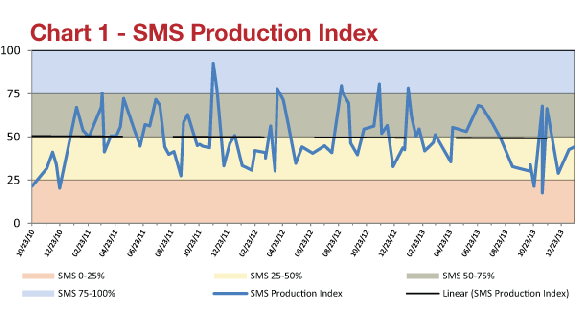
The SMS Production Index, shown in Chart 1, ranks the last 1,000 closeouts, providing a graph showing the last 100 closeouts. Chart 1 uses four production numbers that we are able to compare over the course of several years without worrying about market changes. The comparisons can be made between different producers marketing to multiple packers.
The four production numbers in the SMS Production Index include:
¢ Death Loss & Dead On Arrival (DOA) by percentage
¢ Culls & Lights by percentage
¢ Average Daily Gain (ADG)
¢ Adjusted Feed Conversion
We have created a model we call the SMS Crush so we can give economic values to each production number. As costs for isowean pigs, market hogs, feed, housing, etc. change, the model can be adjusted to show the impact of the variables in what we call “opportunity dollars” lost per pig.
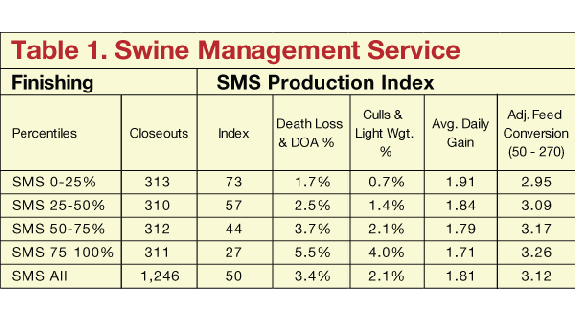
Death Loss and DOAs have a bigger impact on lost opportunity dollars than most people think. In the SMS database of 1,247 finisher closeouts, Death Loss and DOAs had an average of 3.4%, with the top 25% of operations at 1.7% and the bottom 25% of operations at 5.5%.
The database shows that the average pig dies at 85 days. Consequently, we took a cost of $79.86 for a feeder pig, $74.16 for feed (feed at $240.00/ton), yardage of $14.29 ($0.12/ day) and $12.00 of other expenses, for a cost of $180.30 per market hog. We took 90% of that number to come up with the cost of a dead pig at $162.27. This means for each 1% change in Death Loss and DOAs, the breakeven cost is changed by $1.62 per pig.
We then looked at Culls and Lights (lightweight pigs) and found the SMS average was at 2.1%, with the top 25% of farms at 0.70% and the bottom 25% of farms at 4.0%. The average market weight was 181 lb. The average income for culls was approximately 50% of market hogs. We used 50% of the SMS Crush of $0.90 per pig for each 1% of cull hogs marketed.
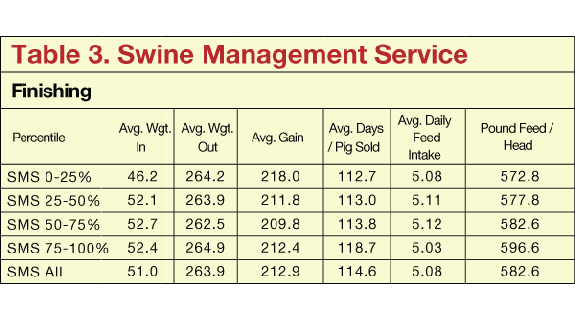
Average Daily Gain (ADG) determines how much time a pig spends in the finisher, or how much the pig weighs at marketing. The average ADG in the SMS database is 1.81 lb., with the top 25% at 1.91 lb. Average daily gain affects the cost in two ways, impacting both the building cost and the weight at which the pig is sold. The top 25% of farms sold at 112.7 days, and the bottom 25% of farms sold at 118.7 days. Each day’s difference is $0.11 in the SMS Crush. The other effect of ADG is the weight of the market hogs. Most finishers work on fixed days for the pigs to grow. An improvement in ADG increases the pounds of market hog you have to sell, with minimal extra feed cost. For each 0.10-of-a-pound increase in ADG over the course of the 114 days in the finisher, the producer gains an extra 11.4 lb. of pork. We capped the extra gain at 5 lb., multiplied by $0.60/pound to add up to $3.00 per pig claimed in opportunity dollars based on packer grids.
Feed Conversion is the fourth variable that makes up the SMS Production Index. There are lots of factors that affect feed conversion, such as energy level of the diets, diet form (meal or pellets), different ingredients, etc. We feel that starting and ending weight are bigger factors when trying to compare feed efficiency from closeout to closeout.
As a result, we decided to use an adjustment equation for the starting and ending weights of each closeout. We calculated the starting weight for finishers at 50 lb. and ending weight at 270 lb. As you see in Table 1, the Adjusted (ADJ) Feed Conversion (50-270 lb.) average was at 3.12 lb., with the top 25% of farms at 2.95 lb. and the bottom 25% at 3.26 lb. This means if the top 25% are at 2.95 lb. and the next 25% are at 1.84 lb., the difference of 0.14 lb. of feed per pound of gain, multiplied by 203 lb. gained, equals 28.42 lb. of feed, which, multiplied by $0.12, equals $3.41 in lost opportunity dollars.
We know that the SMS Crush model is not perfect, and with changing costs every day, the opportunity dollars per pig will be different. However, we feel it is a starting point to help producers evaluate closeout.
In Table 2 we have calculated the Opportunity Dollars/Pig. The four variables are broken out with a total dollar figure. Each 25% is compared to the top 25% of the farms in the SMS data set. The SMS “All lost” total was -$2.79 for Death Loss and DOAs, and -$1.28 for Culls and Lights, with -$3.00 for ADG and -$4.16 for ADJ Feed Conversion. These figures add up to a total lost-opportunity-dollars-per-pig figure of -$11.23.
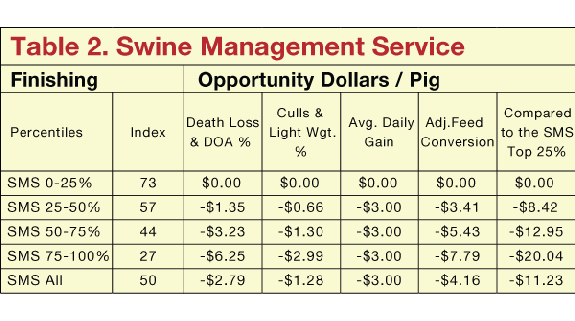
Some other production numbers are found in Table 3: SMS Finisher. It is broken down by farms in the range of the top 0-25%, 25%-50%, 50%-75%, 75%-100% and SMS All. How do your numbers compare?
There are several companies that share and publish nursery, finisher and wean-to-finish data. They give you some reference points to compare your data. At SMS we feel you need to be looking and ranking your own closeouts to see what you need to change to get better. Do you know the performance of the top 25% of your closeouts? How much money are you losing with that bottom 25%?
To make your data more visual and easier to read, we have created the New SMS Closeout Benchmarking program with 22 charts. The SMS Production Index, Chart 1, graphs the ranking for last 100 closeouts; it shows if improvement is being made over time; and it looks for any seasonal effect on the closeouts.
We started with “How do you look at closeout data?” The SMS Production Index is a new concept in looking at closeout data to help the producer rank closeouts by putting them into charts that help when looking for trends and variation. These charts help producers find areas that need improvement and can help increase profitability.
You May Also Like


