Analyzing Piglet Death Loss by Lactation Day
October 14, 2013

This is the third in the series looking at how farm size affects piglet survival by parity, and how piglet death loss varies by lactation day. The ideas for these three articles came from a group in Ohio.
See the other articles in the series: “Analyzing How Farm Size Impacts Piglet Survival” and “Analyzing Farm Performance by Parity.”
For the three articles we selected 48 farms, totaling 112,432 mated females, from our In-Depth Farm Analysis database. Size of farms in this data set ranged from 600 to 5,700 females. For the last 52 weeks the farms had to be at 26+ pigs weaned / mated female / year and be entering piglet death losses by the day of lactation. We then sorted the farms by size, and estimated the number of employees on the farm. Each group was given a range for the number of employees on the farm. In the future, we would like to look at some farms that would share the number of hours worked by area so we could calculate pigs produced per hour of labor.
Below see the grouping of the farms used and the estimate of the number of employees:
Group 05 - 4000+ mated females - 5 farms - 13+ employees
Group 04 - 3000 - 3999 mated females - 12 farms - 9 - 13 employees
Group 03 - 2000 - 2900 mated females - 10 farms - 6 - 9 employees
Group 02 - 1300 - 1999 mated female - 11 farms - 4 - 6 employees
Group 01 - 600 - 1299 mated females - 10 farms - 2 - 4 employees
In Table 1, the 48 farms are broken out into the five groups based on size. When looking at the table you will see we have included a new number total born/mated female/year, which shows the average at 34.60 pigs, with the highest average being 35.36 for Group 01 (farms at 600-1299 mated females). Then we calculated pigs weaned /mated female/year. The numbers changed, with Group 05 (farms at 4000+ mated females) at 30.09 pigs and Group 03 down to 26.97 pigs. As we previously discussed, these larger farms are doing a better job of developing gilts and then saving more pigs at farrowing, with lower numbers of stillborns and reduced preweaning mortality.

In this third article in the series, we wanted to look at when piglet death loss occurs broken out by lactation day. The lactation days were broken out as day 0, 1, 2, 3, 4-9 and 10+. To look at piglet death loss by lactation day by farm size please see Table 2 and Chart 1. These are just two different ways to lay out the data for comparison.
Piglet Death Loss by Lactation Day

Piglet Death Loss by Parity and Lactation Day
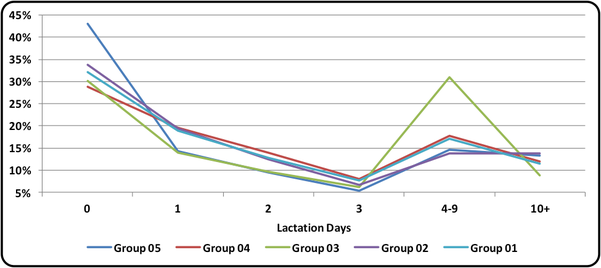
The data shows that Group 05 farms have a much higher piglet death loss on day 0 vs. the other farm groups. This is probably due to most of these farms having extended farrowing hours of 20-24 hours per day, 5-7 days per week. This way the day of death is more accurately recorded vs. writing up the litter the next day.
On the larger farms, most pigs are getting dried off and placed on the nipple within a few minutes after birth and the pigs with abnormalities and small non-viable pigs are being euthanized.
We did a quick calculation adding day 0 and 1 together with the average being 48.8% of the piglet deaths, with Group 05 at 57.2%, and Group 03 at 44.1%. We feel the target for piglet deaths for day 0-1 should be at 60+%, if day 1 pig care is being done right seven days per week.
The green line on Chart 1 (Group 03 farms) shows a jump in piglet deaths on days 4-9 after farrowing. Most of the 2,000-2,900-sow farms only have someone in the farrowing room for 8-10 hours per day, which probably increases the number of chilled and stressed pigs born when someone is not in the farrowing house. This increase to 31.0% of the piglet deaths on days 4-9 is probably the fall-back pigs that are not being found before falling behind and then being recorded as a laid-on pig. In many cases, these pigs were starved, causing them to be laid on. This situation goes back to our thought that there are not enough people providing labor at farrowing time. Adequate labor could help sort out the fall-back pigs and get them help with nurse sows or transferring them to rescue decks with supplemental milk.
In Table 3 and Chart 2 we pulled out Group 05 (farms at 4000+ mated females), breaking them out by parity and lactation day for piglet death. As you see by parity, the numbers are very tight. Note that 40+% of the piglet deaths occur on day 0, 13+% happen on days 4-9 and 10+% are taking place after day 10+. Once again, these farms are providing extra labor during the farrowing process in order to improve day 1 pig care.
Piglet Death Loss by Parity and Lactation Day

Piglet Death Loss by Parity and Lactation Day
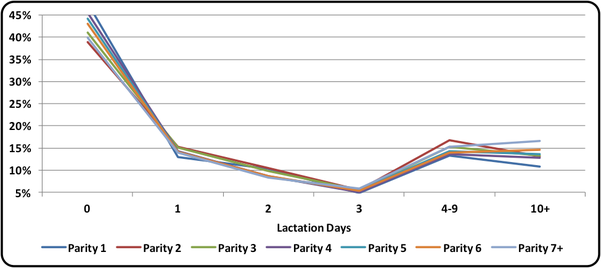
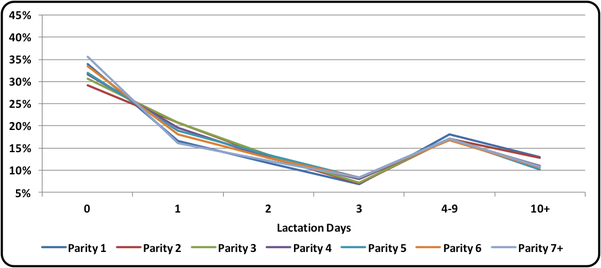
Table 4 and Chart 3 look at Group 01 (farms at 600-1,299 mated females). Like the Group 05 farms, the numbers are very tight. The difference is the drop in piglet death loss on day 0 at 32.0%, vs. Group 05 at 43.0%. These tables and charts arranged by group size confirm that parity does not have much influence on the day a piglet dies.
Piglet Death Loss by Parity and Lactation Day

Group 1 Piglet Death Loss by Parity and Lactation Day
We thank the group from Ohio for the topic and how we have answered their questions. The farms in this data base have several different genetic suppliers. The take-home message is that quality labor applied to day 1 pig care results in lower stillborn rates and decreased preweaning death loss, plus an improvement in piglet survival.
The farms that are extending the amount of time that someone is in the farrowing rooms helping sows farrow, drying pigs and doing split-suckling of pigs on day 1 are weaning and selling the extra pigs. They are taking advantage of that true extra genetic potential of 36+ pigs/mated female/year. Is it time to make some changes to your Standard Operating Procedures and get more labor in the farrowing rooms?
Previous Production Preview columns can be found at www.nationalhogfarmer.com.
Key Performance Indicators
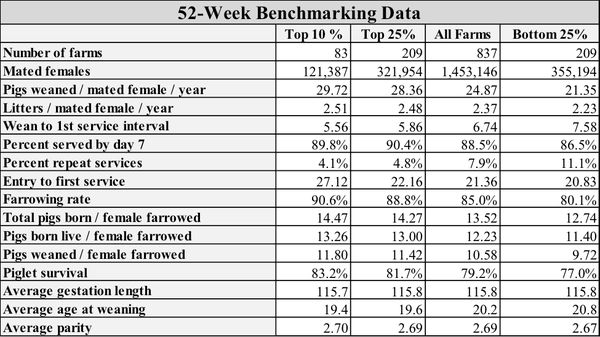
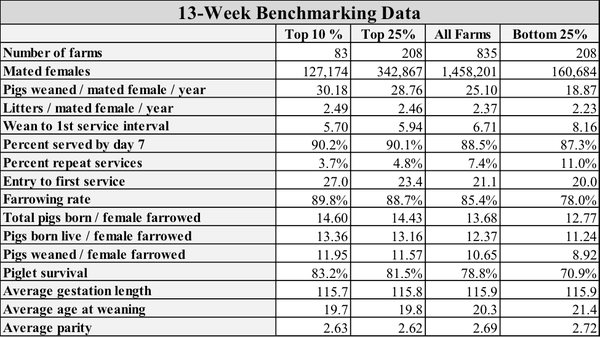
Until the benchmarking data base is rebuilt, we will continue to use the old one for the data for Tables 5 and 6 (below) that provide 52-week and 13-week rolling averages for key performance indicators (KPI) of breeding herd performance. These tables reflect the most current quarterly data available and are presented with each column. The KPI’s can be used as general guidelines to measure the productivity of your herd compared to the top 10% and top 25% of farms, the average performance for all farms and the bottom 25% of farms in the SMS database.
We are always interested in topics for articles so feel free to send us a note or call. The large database we use for information in the articles is being updated next month. Farms that are in the Farm Benchmarking program will be asked to update their Farm Information Sheet with even more details so in the future we can do more in-depth articles. One area we are very interested in is the influence of farrowing crate design on stillborns and preweaning death loss.
If you have questions or comments about these columns, or if you have a specific performance measurement that you would like to see benchmarked in our database, please address them to: [email protected]or [email protected].
You May Also Like

