USDA Hogs & Pig Report: Steady as she goes
USDA estimates were close to the average of analysts’ pre-report estimates, suggesting the report was neutral for Lean Hogs futures, but those contracts have rallied since the report’s release.
October 2, 2017
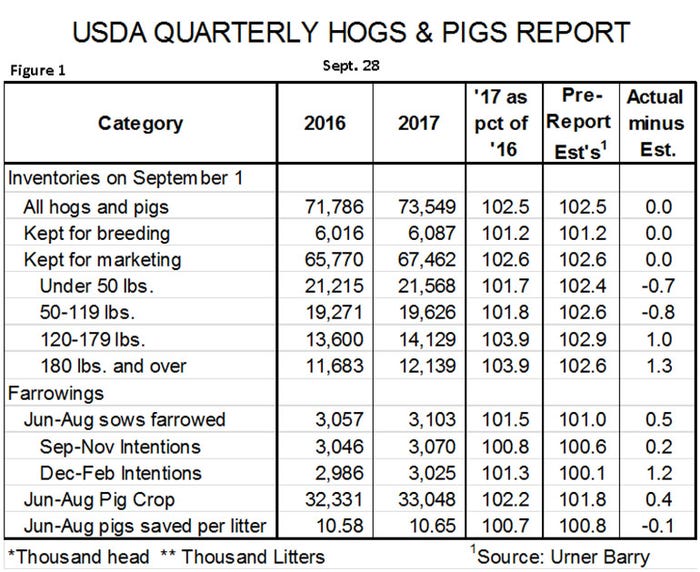
USDA’s quarterly Hogs and Pigs Report, released Sept. 28, indicates continued moderate growth of the U.S. hog production sector. Key national data from the report appear in Figure 1. Note that most of the USDA estimates were very close to the average of analysts’ pre-report estimates.
This similarity suggests that the report was neutral for Lean Hogs futures, but those contracts have rallied in both trading sessions since the report’s release. Lean Hogs traders obviously expected worse news in the report.
Key numbers and their implications are:
• For the first time in my memory, all of the two big national inventory numbers — and thus the third — came out exactly equal to the average of analysts’ estimates. A breeding herd of 6.087 million head was, as predicted, 1.2% larger than one year ago. The market herd of 67.462 million head — a Sept. 1 record — was 2.6% larger than one year ago. The combined herd of 73.549 million head was also record high for Sept. 1 and 2.5% higher than one year ago.
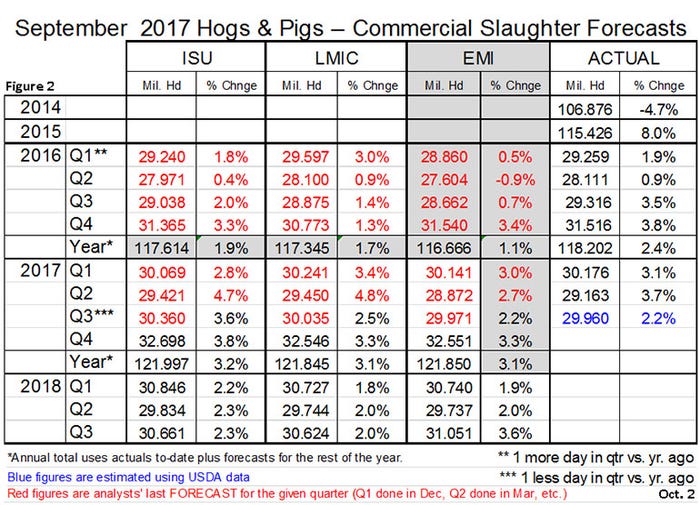
• The only numbers in the report that do not fit well with pre-report estimates are the weight class inventories. Both the 180-pound and over and 120-179 pound inventory were sharply larger than anticipated while the lighter weight classes were smaller. The 180-plus category (3.9% larger year over year) agrees reasonably well with September slaughter to date (+3.3%). The larger heavy-weight hog numbers were what I believed would pressure October and December futures but the market was apparently expecting still-larger numbers given the $1.70 rally in October futures Friday and Monday and the robust $3.70 rally in December.
• June-to-August farrowings fit the breeding herd growth figure well but farrowing intentions for the next two quarters appear low. Under-estimated farrowing intentions are a firm pattern at this point with actual farrowings exceeding the previous report’s front-quarter intentions in 11 of the past 12 reports. U.S. producers could be sand-bagging the numbers or somehow farrowing more litters than they expect (don’t they know how many sows are bred?). Or USDA could be systematically underestimating. Regardless, the pattern is very strong at this point so we expect farrowings to be 0.8 and 0.3% larger than shown in this report for the next two quarters, respectively.
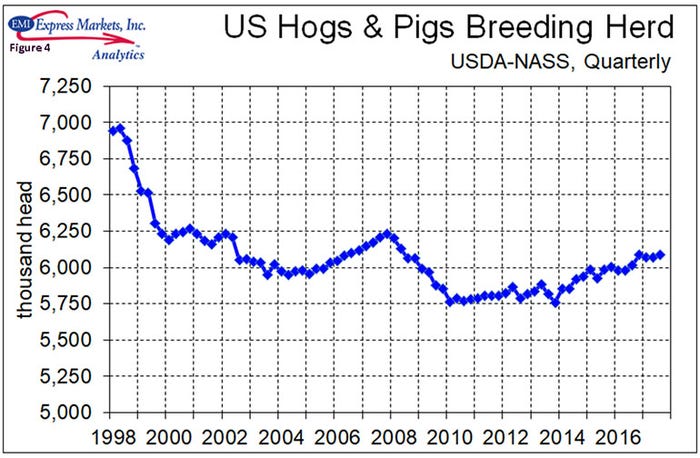
• Litter size growth was as expected by analysts but a bit slower than the past few years. The health status of the U.S. herd is currently excellent with few problems from either porcine epidemic diarrhea virus or porcine reproductive and respiratory syndrome). Good herd health and continued selection pressure for pigs born alive and milking ability will push litter sizes higher — and may do so faster than is indicated in this report. The trend has been consistent recently, however, so we are not adjusting these USDA numbers in our forecasts.
• The 33.048 million head pig crop for June-to-August is another quarterly record. It would suggest December-to-February slaughter somewhere near 2% larger than one year ago. That figure is lower than our June forecast.
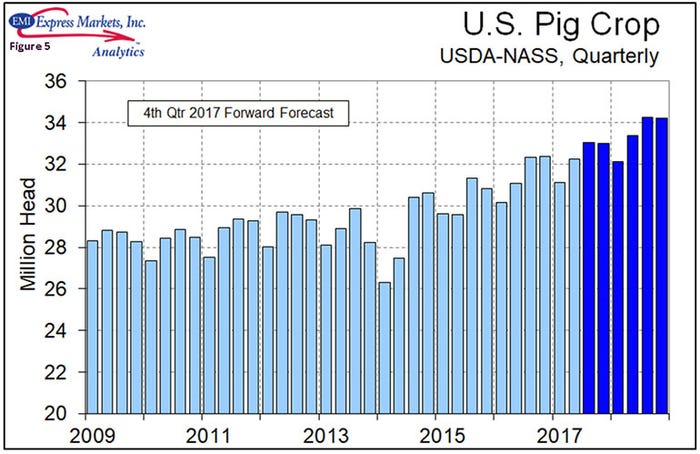
• Ditto for our second and third quarter numbers from this report. Even with our upward adjustments to USDA’s farrowings for the next two quarters, slaughter is slightly lower than we expected based on the June report. Second and third quarters of 2018 will still be up a very healthy 2.0 and 3.6%, respectively.
• This report leaves our forecast for fourth quarter 2017 commercial slaughter at 32.551 million head, 3.3% larger than one year ago and 2017 commercial slaughter at 121.605 million head, 2.9% larger than in 2016. We expect slaughter to grow by 2.5% year over year over the first three quarters of 2018 — a growth rate much the same as we have seen this year.
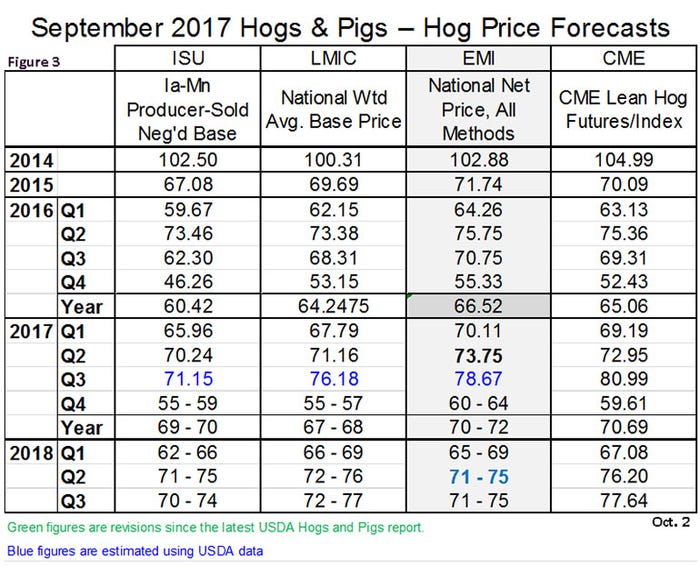
• Projected supplies leave our price forecasts for this year’s fourth quarter slightly lower and the first two quarters of 2018 virtually unchanged. Our first projections for third quarter 2018 pegs the national net price over all purchase methods to average $71-$75 per hundredweight. Our forecasts would put the average price over the first three quarters of 2018 about $3 per hundredweight. lower than what producers saw in the same period in 2017.
About the Author(s)
You May Also Like


