Election, USDA reports have something for everyone
I suspect the government’s hand will be forced in the December report if we are still at loggerheads with China and will have to break this barrier in the name of maintaining a straight face.
November 12, 2018

Regardless of your political affiliation, there is something we can all agree upon — we are all happy that the name-calling commercials are done for this cycle. Neither party got it all “their way” and the stock market responded to the gridlock by rallying over 500 points the day after the election. Odd that all of our 401(k) accounts are rewarded by the perceived stalemate in Washington.
We have a similar situation in two recent reports from the USDA. This past Thursday’s grain report backed off yields for both corn and soybeans (good for the bulls) while increasing world ending stocks precipitously thanks in large part to a revision of government-owned grain in China (good for the bears). After vacillating both green and red for the day, the market ended the day of the report nearly unchanged across on all commodities.
The USDA also released their preliminary look at economic projections through 2028 (the official numbers will be released in February) and they, too, had a little bit of something for everyone. We will break down these two reports in this column.
The USDA report did, as many had anticipated, with corn and bean yields in the United States, lowering corn 1.8 bushels per acre and beans 1.0 bushels per acre. The crummy harvest weather west of the Mississippi River probably contributed to some of this as well as the realization of damage from so much moisture late in the growing season in those same areas. This adjustment snugged up the domestic corn balance sheet to a carryout that is now sub-1.800 billion bushels, on the cusp of getting the attention of the world export trade.
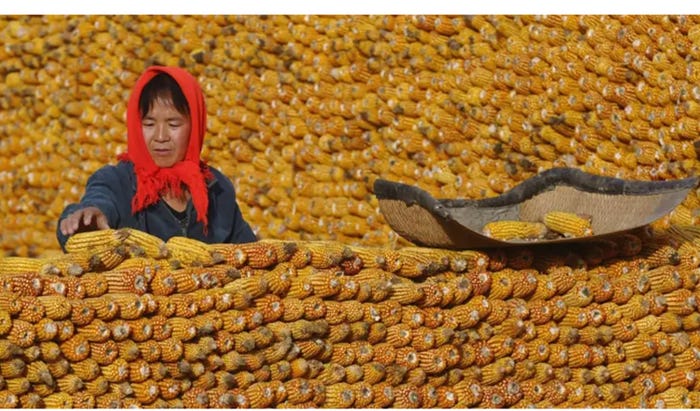
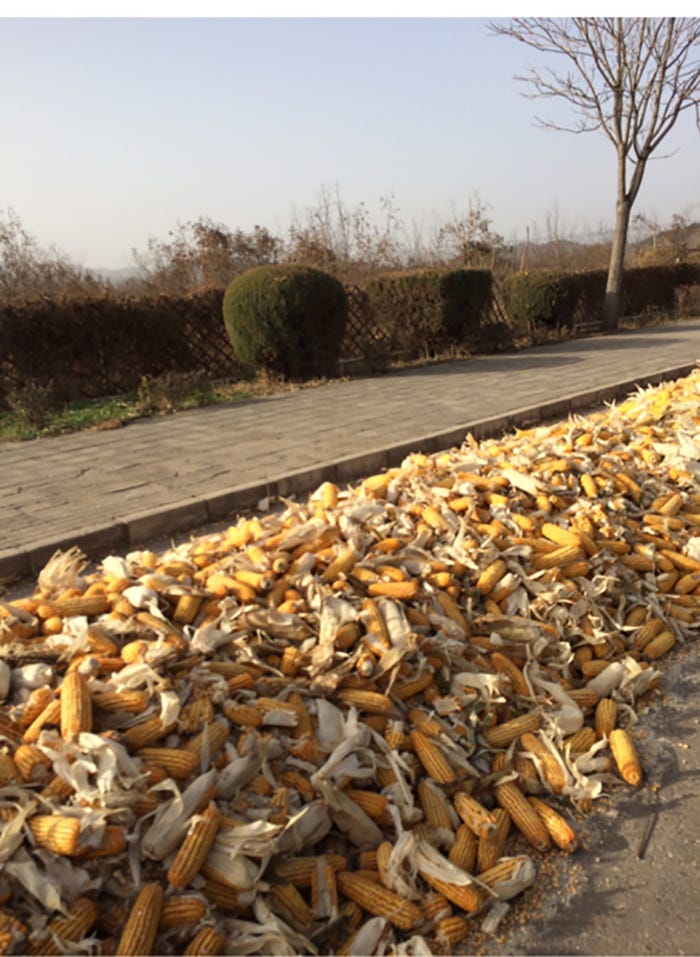
As mentioned, China stocks were revised going back to 2006, adding a whopping 10 billion bushels to world stocks. It is hard to fathom how numbers could have been so far “off” … until you visit the Chinese countryside to see how corn is stored. It is not in nice shiny steel bins, it is generally in piles, some neater than others, near where it was harvested and left on the cob. The first picture is from the internet and is much more organized than what I have witnessed. The second picture is taken from the car window along a rural area northeast of Beijing.
So, this begs the question of corn price discovery. In my opinion, it does little to change our outlook. China was never going to be a player in the export market and has been quiet on the import front, too. Those who were looking for a buying boom from China sometime in the future may have had their horizons pushed out a bit, but the day-to-day price discovery in the market was probably not influenced by this news.
Bottom line: the corn balance sheet just got a little tighter. This probably puts a decent floor under the CME and puts the onus on basis to regulate the movement of corn across time and space.
The soy balance sheet is a bit more interesting. The USDA reduced yields and also reduced demand, resulting in a carryout of nearly 1.0 billion bushels. Recall, our previous high carryout in the history of the United States was 574 million bushels in 2006 when prices hovered around $6 per bushel. We are nearly twice as high on our carryout projections, albeit against a higher demand base, as the previous record and the market shrugs.
Two things seem to be going on, here. First, there is anticipation that President Trump and President Xi will eventually reach an accord. It would be best for the world, it would certainly be good for U.S. soy producers, and let’s face it — China and the United States need each other long-term for the health of both economies. This situation will be rectified sooner or later, and the market is anticipating the same with its pricing. Second, the USDA could have easily shown a 1.0-billion-bushel carryout on the November balance sheet. The fact that they eased into the demand reduction probably represents a reluctance to make the precedent in printing a four-digit carryout in beans.
I suspect the government’s hand will be forced in the December report if we are still at loggerheads with China and will have to break this barrier in the name of maintaining a straight face.
To me, the most interesting thing in this whole equation is how the acreage battle plays out in the spring of the year. My attached balance sheets try to depict what a 4-million-acre swing from beans to corn looks like — basically necessary to keep the carryout in both crops on an even keel from year to year. It will be the job of the market to price corn attractive enough to the farmer to incent him to switch from beans. If — if — the trade dispute is resolved by the spring, this will be an interesting scenario with my best guess of higher prices than where we sit now necessary to shift the planting intentions. Keep this one on your radar.
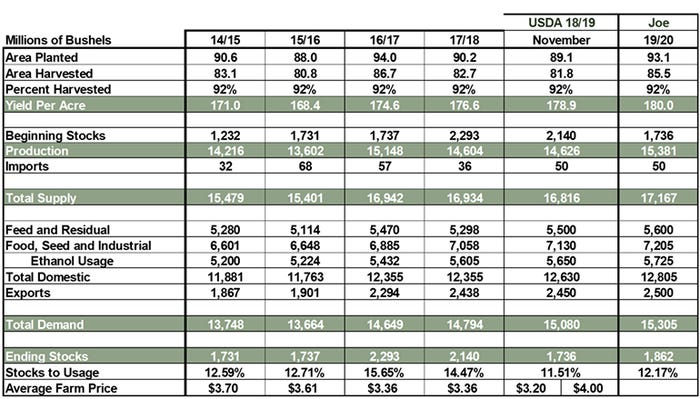
Corn balance table, adding 4 million acres for next year, 180 bushels-per-acre yield.
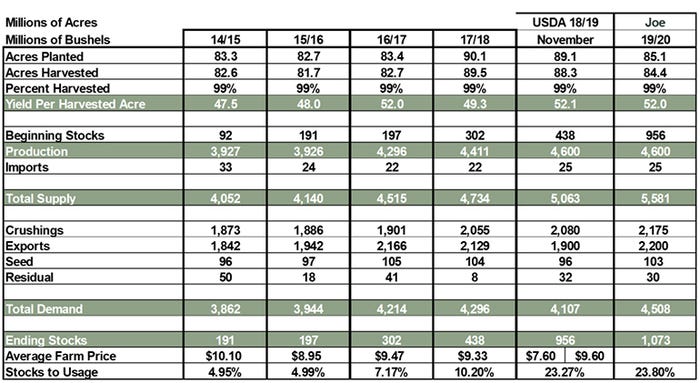
Soy balance table, reducing acreage by 4 million, assumes China back in export market next year, 52 bushels-per-acre yield
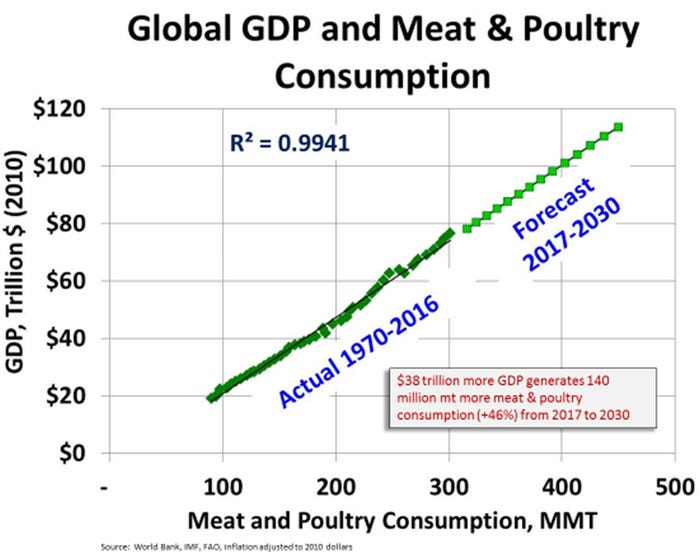
The Early Release tables from the USDA depicting the next 10 years of trends and prices had a few interesting take-aways. U.S. and world gross domestic product numbers are consistent (U.S. 2.0% over the next 10 years, world at 2.8%) and boring. In this case, boring is good. Recall the high correlation between world GDP growth and protein consumption. If this trend holds intact, we will need almost 50% more protein across the world in the next decade or so. This may sound too good to be true, but the math does not lie. Remember that the United States represents only 5% of the world’s population and over 40% of the wealth. It is not about us, it is about the rest of the world. Sometimes it is too easy to just look out our back door for our perceptions when a bigger perspective is required to understand the whole picture.
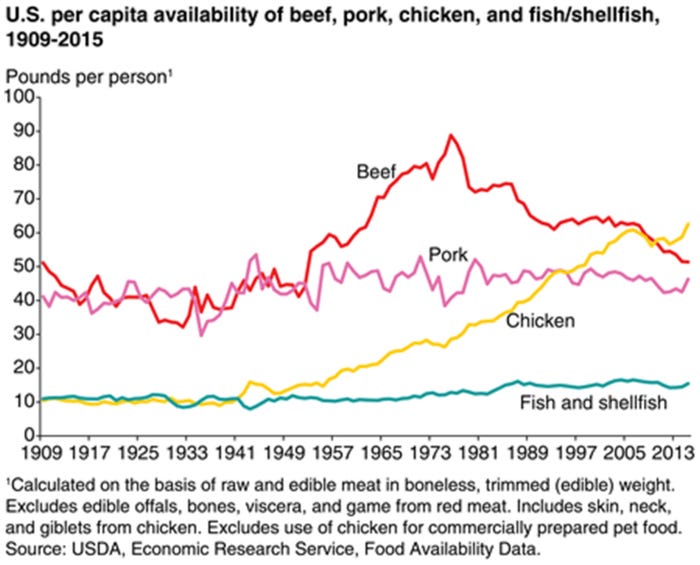
The second thing that jumped out at me from the long-term projections is consistent with what I shared above regarding the export markets as the key to success for the protein sector, it just surprised me a bit. After several years of per capita increases in broiler consumption (graph attached) we are forecast to flatten out just shy of 95 pounds per person. This is occurring as the United States is on the cusp of opening six new poultry processing facilities in the next year. The economics for our feathered counterparts does not look too rosy, declining from a national composite price of 97 cents per pound this year to the high-80s for as far as the eye can see. Before we get too smug, the same USDA that thinks the chicken guys are going to struggle to find profits have the pork sector at essentially breakeven for the same timeframe. It is tough to overemphasize how import exports are going to be to the U.S. protein industry in the coming years.

Comments in this column are market commentary and are not to be construed as market advice. Trading is risky and not suitable for all individuals. Joseph Kerns
About the Author(s)
You May Also Like


