Be consistent in the time you start heat checking each day. Even a few hours different from day to day can impact results.
This month we want to take a look at how the number of matings impacts a number of key performance indicators. First though some definitions for the context of the article.
Number of matings: The number of semen doses a female receives during a single heat cycle (service), this could be the result of matings on a 24-hour interval or a 12-hour interval (a.m./p.m.)
Number of services: The number of heat cycles between outcomes. For example, a first service female would be a gilt’s maiden insemination or the first heat cycle mating of a weaned sow. A second service would be the first repeat mating and a third-plus service is two-plus repeats.
Cycle: For this article, cycle is defined as the time from the breeding event to weaning; a Cycle 0 female is the breeding of a gilt and the first parity farrowing results.
Parity: Parity is the term used from farrowing to farrowing; gilt (Parity 0) becomes Parity 1 in production software the day she farrows.
This is a difficult area to look at across farms because of a number of variables. There are farms that only provide a maximum of two matings. Some farms are using post-cervical artificial insemination and some conventional. Still other farms use a synchronization product followed by a single mating on weaned sows; these farms were not included in this article.
For this article we started with 38 farms and in Table 1 shows the variation within them. There are farms that every female is receiving at least two doses and if those farms are breeding on a 24-hour interval there are certainly some animals that should not be getting two doses. On the other side, there are farms that are as high as 76.4% of the females receiving three doses. In this case they are likely breeding before they are in solid standing heat. There are also farms that only enter the first mating and do not enter second and third matings.

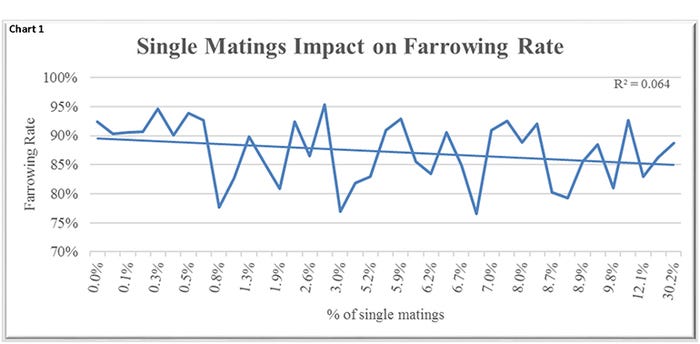
Chart 1 shows the farms ranked from the lowest percent single matings to the highest compared to the overall farrowing rate. The trend line shows the higher percentage of single matings the lower the farrowing rate but it also shows the huge amount of variation that occurs between these farms. This variation can be contributed to a number of things but mostly the differences in people. The overall farrowing rates for the farms from three years from 2016 to present ranged from 77.3% to 95.4% on over 908,000 matings.
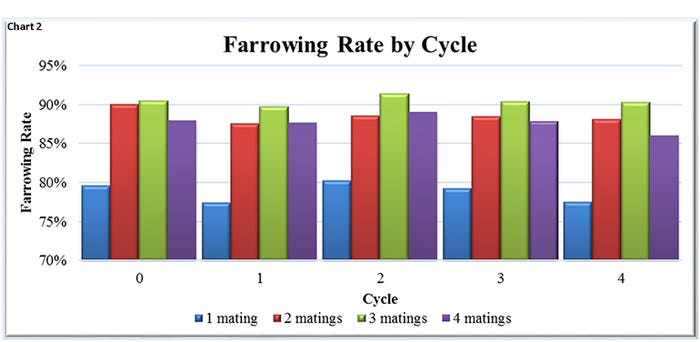
In Chart 2, the impact of number of matings by cycle for the early parity females. Across all cycles those with a single mating are the lowest at 79% farrowing rate versus two matings at 89%, three matings at 90% and four matings at 88%.
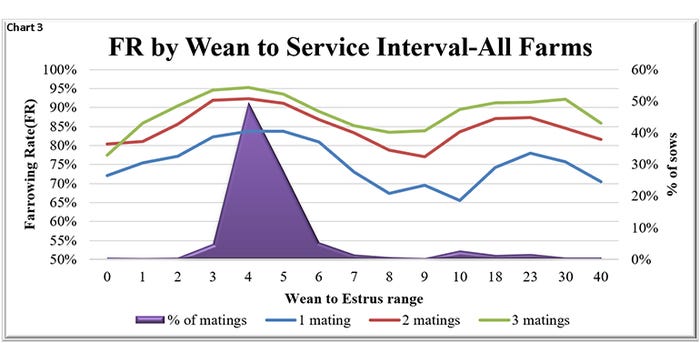
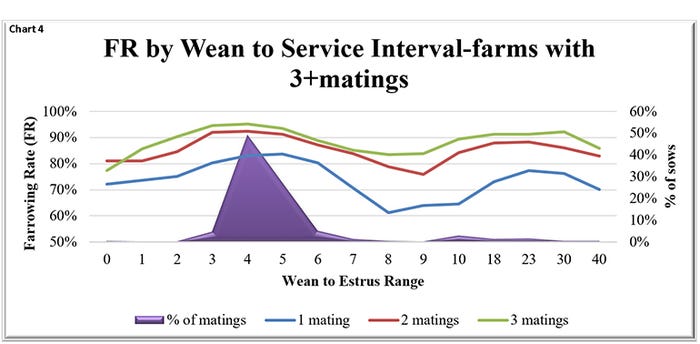
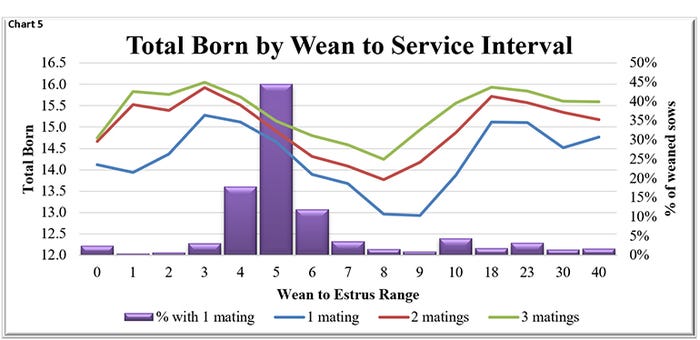
Wean-to-service interval can impact the number of matings a sow receives. Chart 3 shows that for are all 38 farms. Wean-to-service interval is individual days up to Day 9, and then groups of days. For example, 10 on the graph represents those with a wean-to-service interval of 10 to 17 days, with 18 representing those bred 18-22 days after weaning. The purple represents the percent of matings for each wean-to-service range with the right axis. Chart 4 shows the same information but for the farms that are utilizing three or more matings. Chart 5 looks at total born for the same farms in Chart 4. Total born is actually peaking on Day 3 regardless the number of matings. Regardless of wean-to-service interval, those with one mating have the lowest total born in each area. Interestingly, in the purple it shows that 62% of the weaned sows getting one dose were served Day 4 or 5 post-weaning. Is this because of the large numbers bred those days, with breeder fatigue or even those females locking up ahead of a technician getting to them?
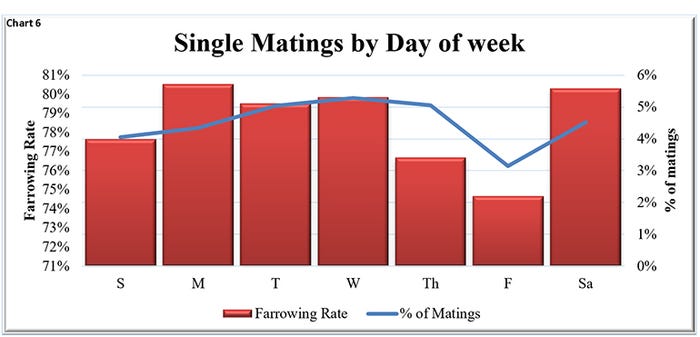
The data show pretty consistently that single matings are going to result in lower farrowing rate and total born, so when are the 8.1% of the single matings occurring, every day! Chart 6 shows that each day of the week has between 3.1% and 5.3% of the matings for the day resulting in a single mating. By day of the week the farrowing rate only varies from 75% on those mated on Fridays to 81% on those mated on Mondays.
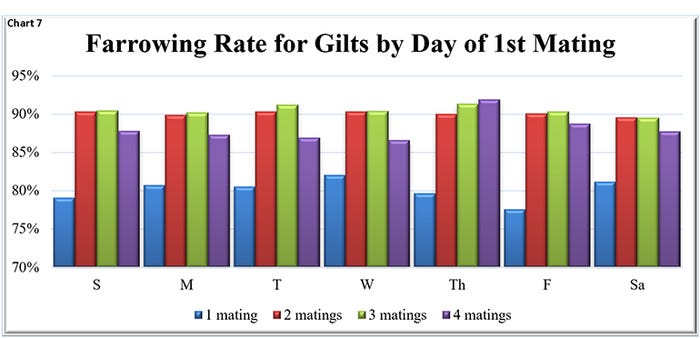
Gilts are more likely to receive just one mating with them contributing 30% of single matings for the farms. Again, the number getting a single mating varies little by day of the week ranging from 5.7% to 6.3% of the gilt matings that are occurring on a given day. Chart 7 shows the farrowing rate performance by day of week based on the number of matings from one to four. Those gilts with a single mating at 80% farrowing rate on average compared to those getting two matings at 90% and three matings at 91%.
Some ideas to consider helping improve performance:
Be consistent in the time you start heat checking each day. Even a few hours different from day to day can impact results.
Give extra attention to those that are a challenge, gilts, late-weaners and repeats. Both from a boar exposure standpoint to help induce a more solid heat as well as stimulation during the mating.
Heat check gilts twice a day. The gilts found in heat in the afternoon should be bred when you find them and again the next morning and 24-hour intervals from there.
Flag those at risk to watch extra closely for repeats, single matings are certainly a risk.
Look at your farm’s data. Is this a problem? Is it only with a single technician?
Provide retraining opportunities for the staff, discuss the heat cycle of sows, when does the semen need to be delivered compared to when she ovulates.
Above all else, if she isn’t standing she doesn’t need a mating.
Are you recording all the matings and doing the analysis to get the highest farrowing rate you can get? What does your data say?
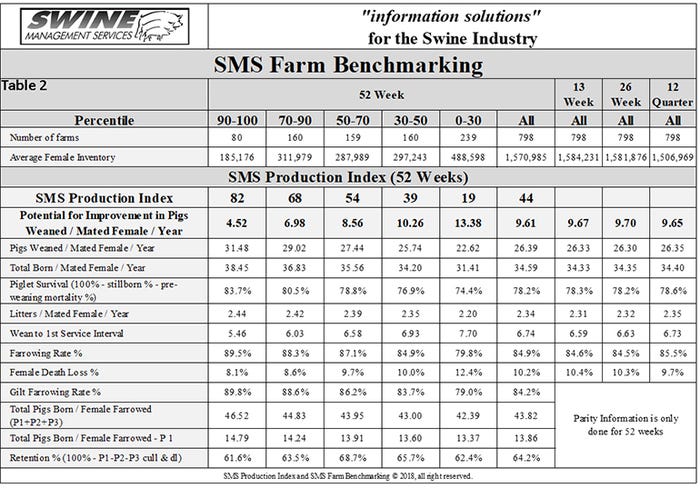
Table 2 provides the 52-week rolling averages for 11 production numbers represented in the Swine Management Services Production Index. The numbers are separated by 90-100%, the 70-90%, the 50-70%, the 30-50%, and the zero to 30% groups. We also include the 13-week, 26-week and 12-quarter averages. These numbers represent what we feel are the key production numbers to look at to evaluate the farm’s performance.
At SMS, our mission statement is to provide “Information solutions for the swine industry.” We feel with the creation of different SMS Benchmarking databases for all production areas we now have more-detailed information to share with the swine industry. If you have questions or comments about these columns, or if you have a specific performance measurement that you would like us to write about, contact Mark Rix, Ron Ketchem or Valerie Duttlinger.
We enjoy being a part of the National Hog Farmer NHF Daily team. Previous articles can be found at NationalHogFarmer.com.
Sources: Ron Ketchem, Mark Rix and Valerie Duttlinger, Swine Management Services LLC, who are solely responsible for the information provided, and wholly own the information. Informa Business Media and all its subsidiaries are not responsible for any of the content contained in this information asset.
About the Author(s)
You May Also Like
