What ails the hog market?
I think it is clear that it is neither export nor domestic consumer demand. That leaves supply to impact both pork and hog prices and packer margins to perhaps pressure hog prices further.
October 7, 2019
The old saying is that “The whole world looks like a nail if you are a hammer.” I’ll plead guilty now to this charge: The whole world looks like supply and demand if you are an economist. I know there are confounding issues, but I always have to start with supply and demand. And forgive me but I still think that is appropriate, so here we go.
Demand first. It is difficult to gauge the level of demand precisely because the data are not fully appropriate or accurate. The best we can do is look at export quantity and value to get an idea of what is happening in that realm and then look at per capita consumption and real (deflated) price to judge the situation in the domestic market. We have complete data only for January through August.
Watching the headlines all year, one would think export demand is a disaster. But in spite of continued tensions and disappointing negotiations with China, no apparent progress on ratifying the U.S.-Mexico-Canada Agreement and a new deal with Japan (that, while it does catch us up with competitors is still a few months away from being implemented), exports so far in 2019 have been strong.
On a product-weight basis, total exports in August were 20% larger than last year in tonnage and 21.4% higher in value. That means the unit price this year ($2.816 per shipped pound) is higher than one year ago ($2.787). Deflating this year’s price to put both of those in constant dollars puts this year’s price at $2.767, just $0.02 lower than one year ago. That change is just 0.7% versus a tonnage change of 20%. I don’t know of anyone who has a price elasticity of demand for U.S. pork exports estimated from actual economic modelling. but a 20% increase in volume versus just a 0.7% decrease in price tells me that export demand was, in fact, quite strong in August.
Year-to-date data are not quite so encouraging. Total exports through August were up 4.6% versus one year ago while the average deflated value of those exports was $2.563 per pounds, 6.4% lower than one year ago. Based on U.S. price flexibilities of -2 to -3, I would have expected the price to be even lower given that level of export growth, but I don’t know (or believe) that the U.S. flexibility should apply to export data.
Suffice it to say that the quantity change-price change relationship for 2019 to-date is not nearly as positive as it was for August. The same is true for July. I think we should all be asking “What have you done for me lately?” since those periods are far more important for the here and now — and the future — that is the situation in the first half of the year.
Domestic demand has been strong so far in 2019. Year-to-date real per capita expenditures stand at $120.27 (2014 dollars) versus $116.16 last year. That 3.5% increase is the best we’ve seen for January-August since 2015 when pork RPCE ended up 4% higher, year over year, for the entire year. August RPCE was down slightly (0.6%) from one year ago, but that is only the second month this year for which RPCE has been lower than last year (see Figure 1).
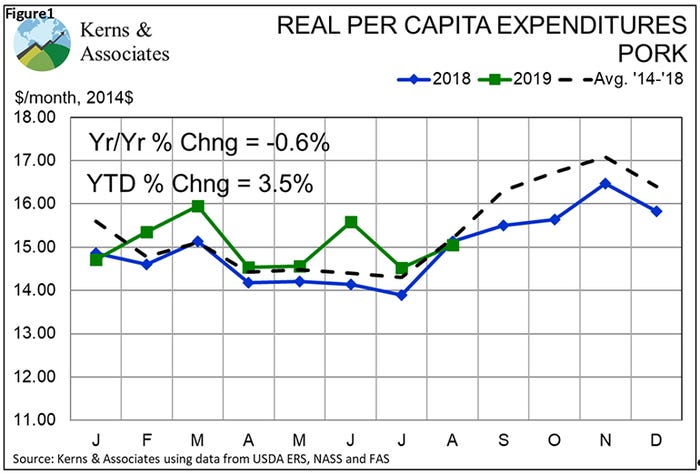
RPCE is the product of per capita pork availability/disappearance/consumption and the deflated retail price of pork as reported by the USDA. The negative relationship between price and quantity is accounted for by multiplying the two factors and the resulting product mimics my more-complicated pork demand index almost perfectly.
So again: What ails the pork/hog sector? I think it is clear that it is neither export nor domestic consumer demand. That leaves supply to impact both pork and hog prices and packer margins to perhaps pressure hog prices further. Let’s discuss the latter first.
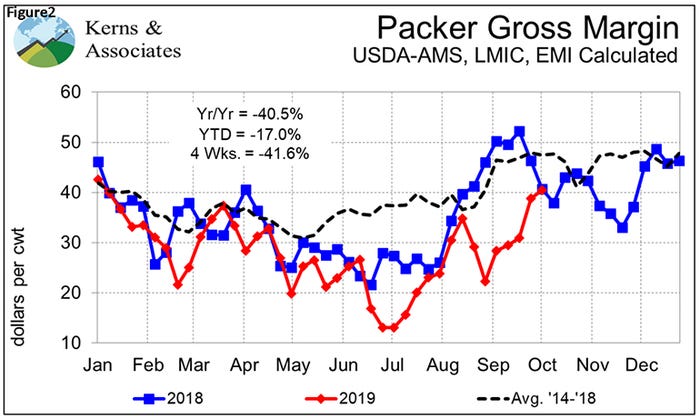
As can be seen in Figure 2, gross packer margins have been nothing to shout about in 2019. In fact, until recent weeks they have been abysmal, averaging just $28.17 per head so far this year versus $34.11 per head last year. Before anyone says “$28 per head sounds pretty good to me!,” realize that only the hog is paid for in arriving at that gross margin. Packers must still pay labor (you think that might be a bit more costly than in the past?), energy, packaging, transportation, etc., from that gross margin before a net margin is realized. I think it takes at least $28 for the lowest-cost packers to get in the black and probably takes well over $30 for the average producer to have a positive net margin. I think it is safe to say that packer margins have not exerted as much negative pressure on hog prices this year as they did last year. In fact, the $28.17 is the lowest gross packer margin since 2013 for January through September.
So that leaves supply. Figure 3 shows that federally inspected hog slaughter has exceeded year-ago levels by 8.6% over the past four weeks. Add in barrow and gilt weights that have been 1.3% larger over that time and production is up 9.2% over four weeks. Now that year-on-year growth is as much about last year’s reduced September slaughter levels and market weights as it is about this year’s. We attributed the shortfall in numbers one year ago go to late-winter and spring porcine reproductive and respiratory syndrome losses that caused hogs to be pulled forward most of the summer until a day of reckoning arrived in September.
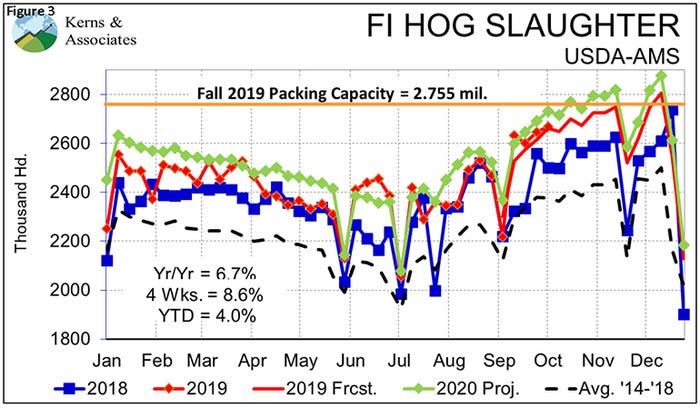
None of that happened this year so seasonal supply growth is far more normal, putting downward pressure on the cutout and on hog prices that was not present last year. Has the downward pressure been normal? No. The past five years have seen the cutout value and hog prices move basically sideways during September before falling the second half of October. This year is really seeing the same pattern, but prices started September at a lower level due to the weakness we saw in August.
Cutout value action the past two weeks is encouraging, and our sources continue to expect product to firm up — perhaps dramatically if shipments to China and Mexico bounce back from their slight declines in August. The national net weighted average price joined the positive side of the ledger last week, gaining $2.78 to average $63.48 . A slight downturn in barrow/gilt weights last week continues to point toward producers being current in their marketings.
We still expect large supplies this fall but as far as I can see, this market is landing about where it should, given all of the factors that I think should affect it.
Sorry, but the whole world still looks like supply and demand to me.
Source: Steve Meyer, who is solely responsible for the information provided, and wholly owns the information. Informa Business Media and all its subsidiaries are not responsible for any of the content contained in this information asset.
About the Author(s)
You May Also Like


