A primer on hog prices
Just what goes into the hog price these days? Here’s a look at the factors involved
September 3, 2018

What’s the hog price? That’s a pretty innocuous question that should have an easy answer, right? But any observer of the U.S. pork industry in recent weeks can quickly deduce that the economic Law of One Price is not holding at all. Why is that and what does the plethora of numbers we see mean?
First, we need to realize that the Law of One Price is a theoretical construct arising from the perfect competition model of markets. In such a model, the assumptions of a homogenous product, full information and instantaneous adjustment leave just one possible level of output and possible equilibrium price at any given moment. It’s pretty easy to conclude that the perfect competition model may be good for teaching economics but is equivalent to the unicorn and bigfoot – not reality.
Clearly, the hogs we sell are not homogenous, are sold at different times and neither buyers nor sellers are working with perfect information. Reality means that we must sort through multiple prices, each of which means something different.
There was a day, of course, when we got price reports from USDA that gave us one price or very narrow ranges of prices. Back then our favorite farm broadcaster would report “U.S. #1 and 2 hogs sold for $46 to $48 in the country today.” That price quote didn’t mean they all brought that price but was the result of some judgement and massaging by trained, experience market reporters at USDA. Those reporters boiled down a wide range of information every day to provide a “market” for hogs. In doing so, however, the details and range of prices in the countryside were not revealed. Price reporting by packers was voluntary and from time to time, one or more of them would simply not provide price data.
Enter the mass structural change of the 1990s and the advent of formula price, long-term contracts, etc. Some producers became convinced that everyone else – or at least the “bigger than me” producer down the road – were getting a better price than they were and demanded mandatory price reporting that captured and reported all prices being paid. “We want to know the range of prices!” was a common mantra. Some even wanted to know every transaction so they could see what packer X paid producer Y.
And for once Congress listened. Sort of. At least to part of the demands. Congress actually punted and told the industry that if it could come to an agreement on what it wanted in the way of mandatory price reporting, they would pass it. After several months of negotiations between producers and packers, Congress did enact the Livestock Mandatory Reporting Act of 1999 and initiated mandatory reporting and a new set of price reports. I think those reports have generally served us well since that time but in the interest of full disclosure, I might be biased since I was one of the people that helped design the system.
After three reauthorizations and a few tweaks, we now get a set of reports that give us different types of information across time and space. Let’s review them and then consider the differences in recent days.
Purchase data
These data deal with packers’ purchases on a given day. They are reported for three regions (Eastern Corn belt, Western Corn belt and Iowa-Minnesota) and nationally. The Iowa-Minnesota data are a subset of the Western Corn belt data and the Western and Eastern Corn belt data are subsets of the National. The data are reported to and published by USDA three times in a 24-hour period: mid-morning and midafternoon for the day in question and then the next morning for the prior day. The same-day reports include only hog numbers, a negotiated base weighted average price and price range. The prior day report includes hog numbers, weighted average prices and ranges for various pricing mechanisms but all are base prices.
The hogs in these purchase data sets will show up at packers over, generally, the next 2-10 days so those purchase prices are indicators of what the slaughter day will reflect over that period.
Slaughter data
These are published each morning for the hogs that were processed the prior day. There is only a national report and it includes a plethora of information including base prices, net prices, and several carcass measurements by purchase method. Net prices and carcass characteristics, of course, are only available after slaughter. The pigs slaughtered on a given day would have been purchased over the last few days, so slaughter data reflect the purchase data over that past period.
Price differences
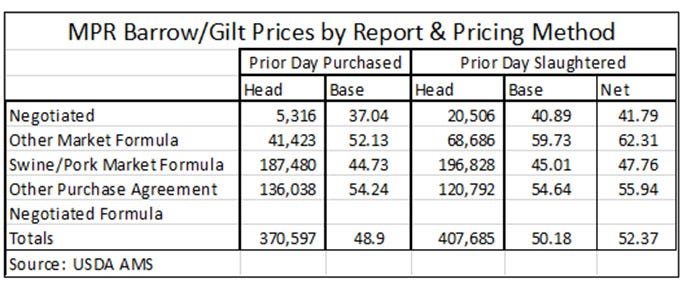
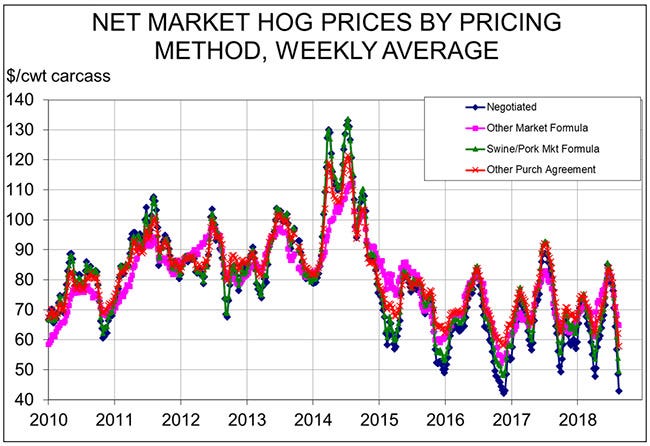
Figure 1 shows the relationships between the volumes and prices of the two different sets of data and the purchase types on August 24. Note the spread between the negotiated and total weighted average prices. They aren’t unprecedented (as can be seen in Figure 2 at the end) but they are definitely wide. And the reason is that the prices represent differences in product and time period.

There are two product differentiations. The first is the clear differentiation of pigs in the Other Purchase Agreement category which includes pigs that earn premiums for production methods and characteristics. Those include ractopamine-free, raised without antibiotics and specific breed genetics. The second is a bit subtler: Differentiation by commitment. A spot-market/negotiated hog is different from one that is committed to a packer on a longer-term formula arrangement. When hogs are plentiful as they have been in recent weeks, that difference results in a substantial discount for spot market/negotiated hogs. Other times it results in a premium as occurred during the PEDv-driven markets of 2013-2014.
And there is now a second component of the commitment differentiation: cutout value pricing. Part of the growing difference between negotiated and swine/pork market formula prices is due to a portion of the SPMF pigs’ prices being based on the cutout value. The spread between cutout and hog market prices generally widens when hogs are plentiful, and packers can push their bids lower relative to the meat value. But some hogs’ prices are based either completely or in part on the meat value, so those prices do not fall as far as the formula prices based solely on the negotiated trade.
The time component of price differences is evidenced by two items in the table. First, note the differences between the purchase data and the slaughter data. Those are primarily driven by the backward and forward aspects discussed earlier and are most obvious in a market that is trending. Base slaughter prices will be higher than base purchase prices when the market is trending lower and vice versa.
The other place the time component is clear is the Other Market Formula price which represents hogs priced using Lean Hogs futures. The OMF-Negotiated differences of $15.09 for purchase data and $20.52 for slaughter data represent hogs whose prices were determined by the October futures price several months ago when the futures market was much more optimistic about October hogs than it is now. Producers locked in “cash contract” prices in those good times but the hogs are just now being marketed. Sellers are getting premiums for these hogs but the net cost of these hogs to packers is likely near the spot price since packers almost certainly sold Lean Hogs futures at the time the producer accepted the cash contract offer. The “Other Market Formula” premiums in Figure 1 are being offset by gains on short futures positions.
Bottom line
In times of turbulent markets, published prices will vary greatly. They are all correct. Remember that reporting the price and characteristics of all hogs is mandatory for any plant that slaughter 100,000 barrows and gilts or more hogs per year. The reports are auditable and fines can be levied if USDA finds a pattern of error. So, the numbers are good.
They differ because the different purchase types generally represent different animals or different time periods. Some animals are differentiated by their ancestry or how they are raised. Some are differentiated by whether they are committed to a processor for the long term or are “free agents” that can find the best – and sometimes the worst – price available.
Time separates the Purchase Data from the Slaughter Data and those can differ markedly if markets are trending higher or lower. Further, the Other Market Formula always represents hogs whose prices were determined at a completely different time than the report date. If the futures market has changed in the interim (as it has this summer), that price can be vastly different from the current spot market.
The weighted average net price across all purchase methods (ie. Totals in the table) from the prior day slaughter report is the best representative of the average price received by producers and paid by packers. While spot prices have been very low, they are received by a minority of producers on a vast minority of the hogs. While today’s “hog market” might best be represented by $37.04 in Figure 1, the best representative of producer revenue is $52.37.

About the Author(s)
You May Also Like


